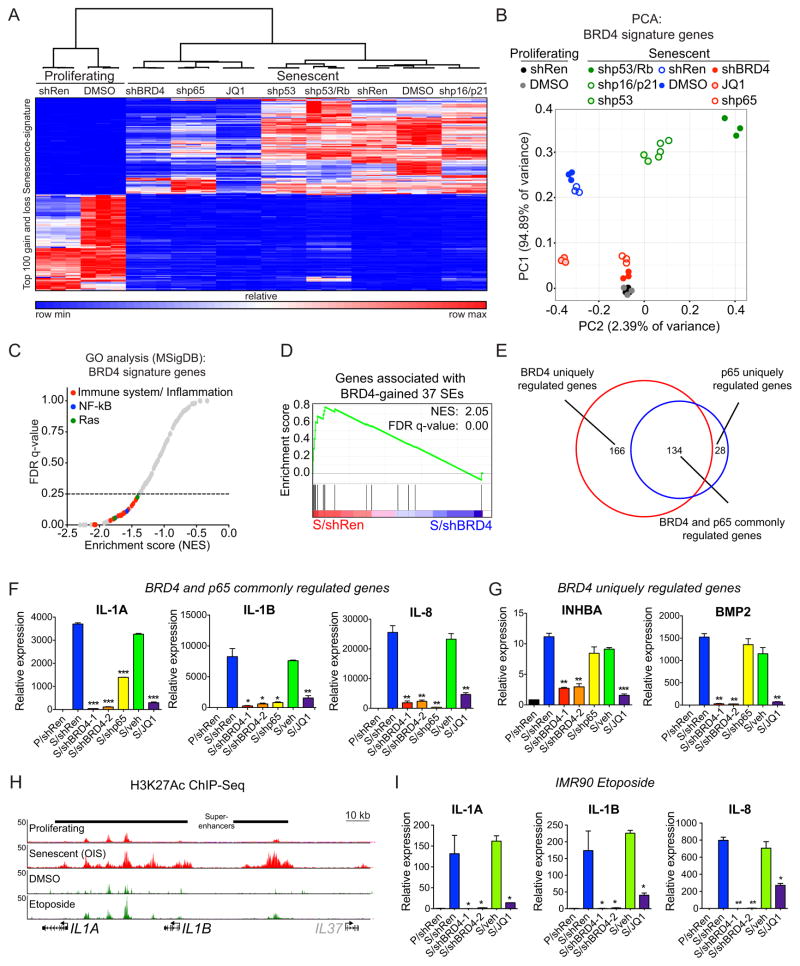
Figure 4. BRD4 bromodomain is critical for expression of SASP genes.
(A) Heat map of supervised hierarchical clustering from RNA-Seq data. Senescence gain- and loss- signatures correspond to top 100 genes that display more than two fold change in senescent (but not in quiescent) cells as compared to proliferating condition. Expression values (rpkm) of combined 200 senescent-signature genes in the indicated conditions were subjected to clustering based on one minus Pearson correlation test.
(B) Supervised principal component analysis (PCA) of BRD4 gene expression signature for the indicated conditions. BRD4 signature was defined by identifying senescent-activated genes that displayed more than two fold decrease with shBRD4 expression.
(C) GSEA on the RNA-Seq data of BRD4 signature genes. 210 gene sets available from the Molecular Signature Database (size of gene set; min=15, max=500) were used in the analysis. From 210 gene sets tested, only 24 gene sets were considered as statistically significant (FDR<25%). Similar gene sets were collapsed as representative groups, including immune system/inflammation-related pathways (red), NF-κB signaling pathway (blue) and Ras-signaling pathway (green).
(D) GSEA of 37 BRD4-gained SE signature following shRen or shBRD4 expression.
(E) Area-proportional Venn diagram showing overlap between senescence-activated genes regulated by BRD4 (red) or p65 (blue).
(F, G) qRT-PCR analyses of the indicated SASP factors in proliferating (P) or senescent (S) cells expressing shRNAs targeting Renilla (neutral control), BRD4 or p65, or treated with vehicle (veh) or JQ1. Shown are representative senescence-activated SASP genes exhibiting BRD4 and p65 co-dependency (F), or only BRD4-dependency (G). See Supplementary Figs. S3C and S3D for additional examples. Data are represented as mean ± standard deviation (SD) of two biological replicates.
(H) H3K27Ac ChIP-Seq occupancy profiles showing gain of H3K27Ac-marked SEs associated with the indicated SASP genes in two senescence conditions triggered by different stimuli. The OIS H3K27Ac mark plots are data from Fig. 1H.
(I) qRT-PCR analyses of the indicated SASP factors in proliferating (P) or senescent (S) cells expressing shRNAs targeting Renilla (neutral control) or BRD4, or treated with vehicle (veh) or JQ1. Senescence was induced by etoposide treatment. See Supplementary Fig. S5C for additional senescence-activated SASP genes exhibiting BRD4-dependency in the context of etoposide-induced senescence. Data are represented as mean ± standard deviation (SD) of two biological replicates.

