
Figure 3.
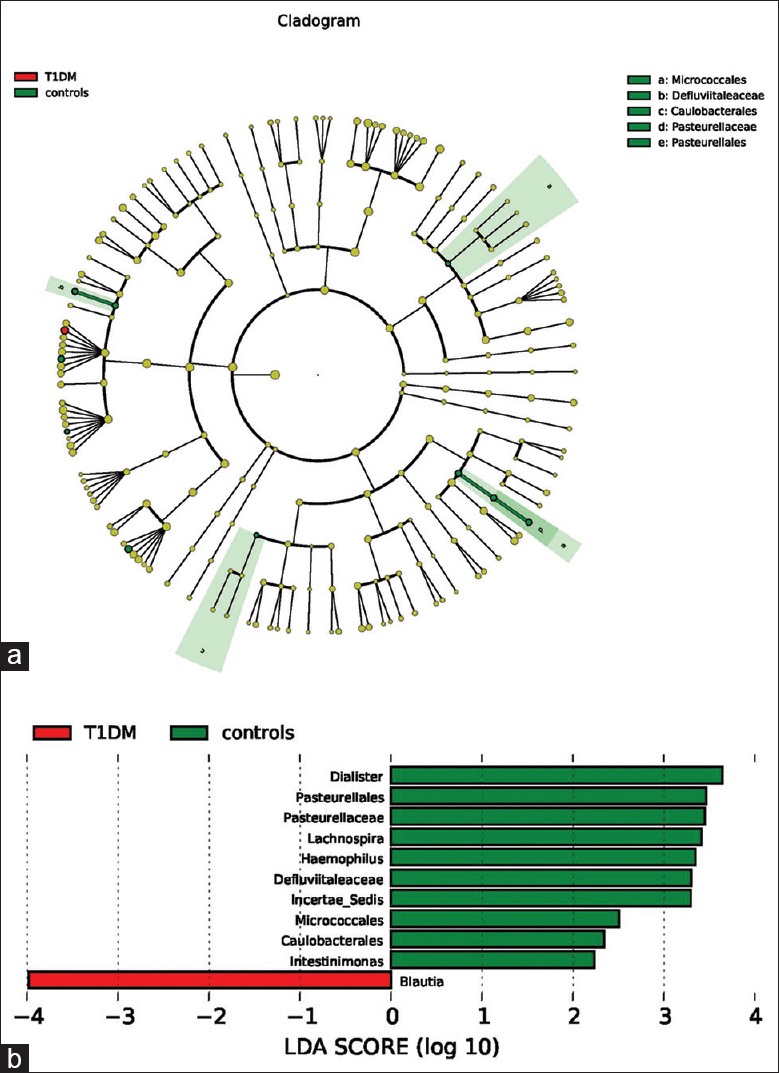
(a) Taxonomic representation of statistically and biologically consistent differences between control and type 1 diabetes mellitus (T1DM) groups. Differences are represented by the color of the most abundant class (red: T1DM group; yellow: nonsignificant; and green: control group). The diameter of each circle is proportional to the taxon's abundance. (b) Histogram of the linear discriminant analysis scores for differentially abundant genera. Linear discriminant analysis scores were calculated by linear discriminant analysis effect size, which is a metagenome analysis approach, using the linear discriminant analysis to assess effect size of each differentially abundant taxon or operational taxonomic unit. Moreover, before this, the differentially abundant taxons were found out by the Mann-Whitney U-test; the cladogram is displayed according to effect size.