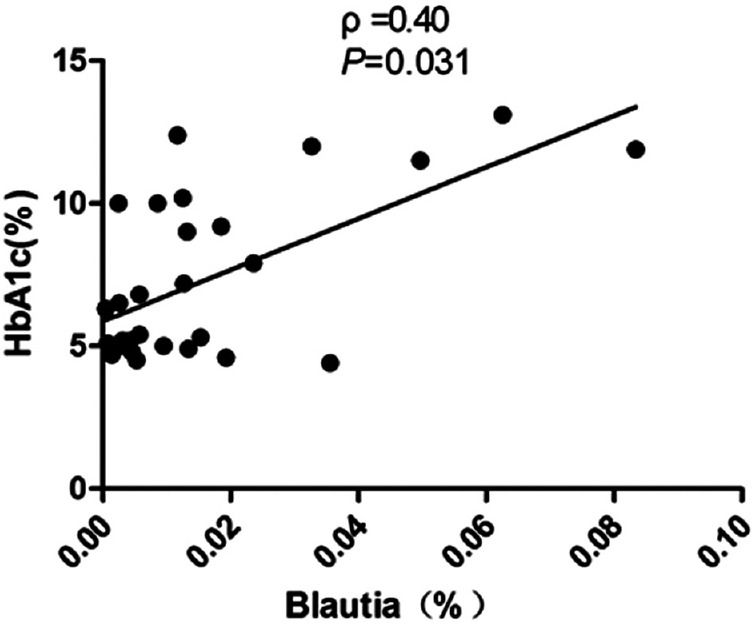
Figure 4.

Correlation analyses between relative abundance (%) of Blautia sequences and HbA1c, using Spearman's correlation analyses (n = 30). HbA1c: Glycated hemoglobin.

Correlation analyses between relative abundance (%) of Blautia sequences and HbA1c, using Spearman's correlation analyses (n = 30). HbA1c: Glycated hemoglobin.