
Figure 6.
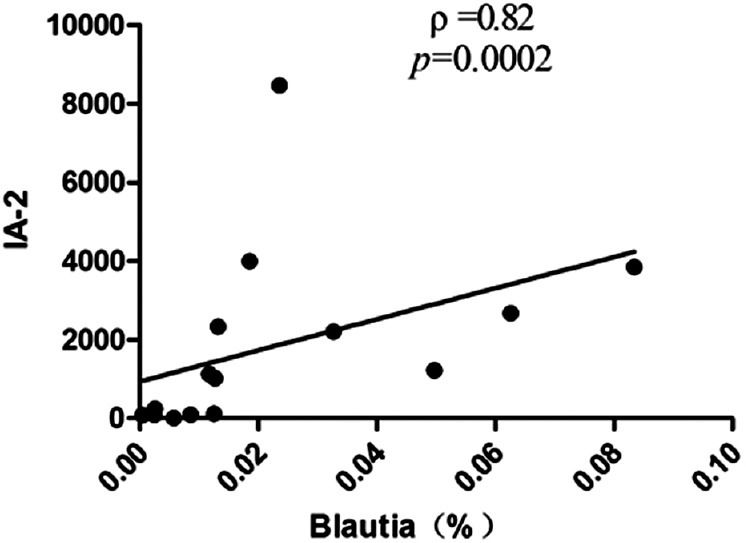
Correlation analyses between relative abundance (%) of Blautia sequences and the titers of IA-2, using Spearman's correlation analyses (n = 15). IA-2: Tyrosine phosphatase autoantibodies.
Official websites use .gov
A
.gov website belongs to an official
government organization in the United States.
Secure .gov websites use HTTPS
A lock (
) or https:// means you've safely
connected to the .gov website. Share sensitive
information only on official, secure websites.
Correlation analyses between relative abundance (%) of Blautia sequences and the titers of IA-2, using Spearman's correlation analyses (n = 15). IA-2: Tyrosine phosphatase autoantibodies.