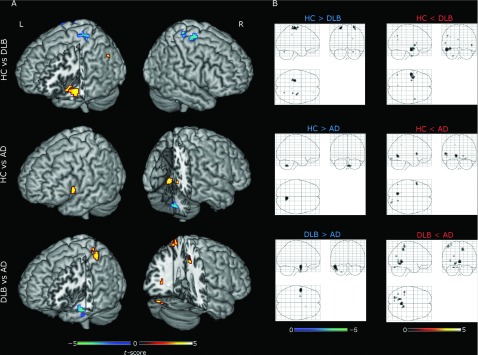
Figure 2.
Regional homogeneity (ReHo) group comparisons. Each row shows results in 3D renderings (A) and SPM glass brains (B), respectively. First row: healthy controls (HCs) versus dementia with Lewy body (DLB) patients (HC > DLB cool colors, HC<DLB warm colors). Second row: HC versus Alzheimer's disease (AD) patients (HC > AD cool colors, HC < AD warm colors). Third row: DLB versus AD (DLB > AD cool colors, DLB < AD warm colors). Results shown at voxel p-value < 0.001 uncorrected with non-parametric permutations (10,000) and presented in neurological convention. A complete list of clusters, regions, and MNI coordinates is given in Table S1.

