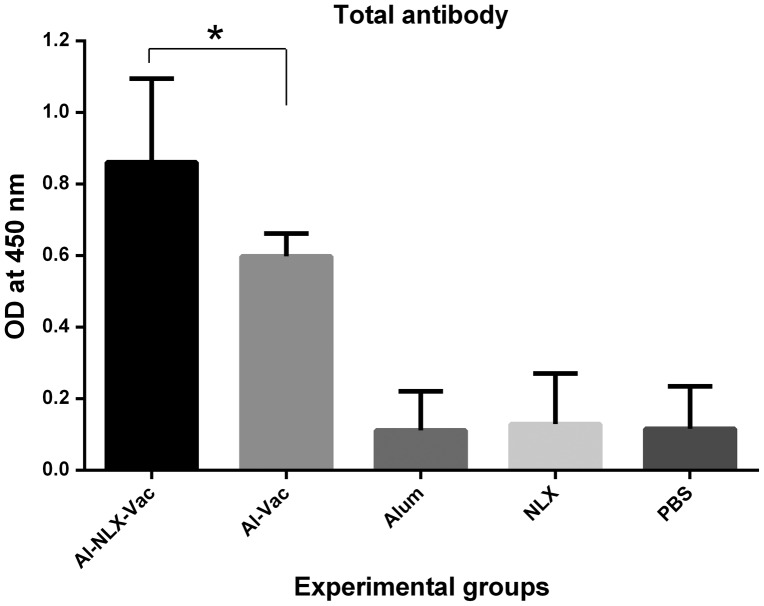
Figure 5.
Total antibody responses in experimental groups. Experimental mice were immunized with vaccines with different formulation and total antibody was evaluated with indirect ELISA method. Data are shown as the mean ± SD. Asterisks represent the groups which were significantly difference (p < 0.05).

