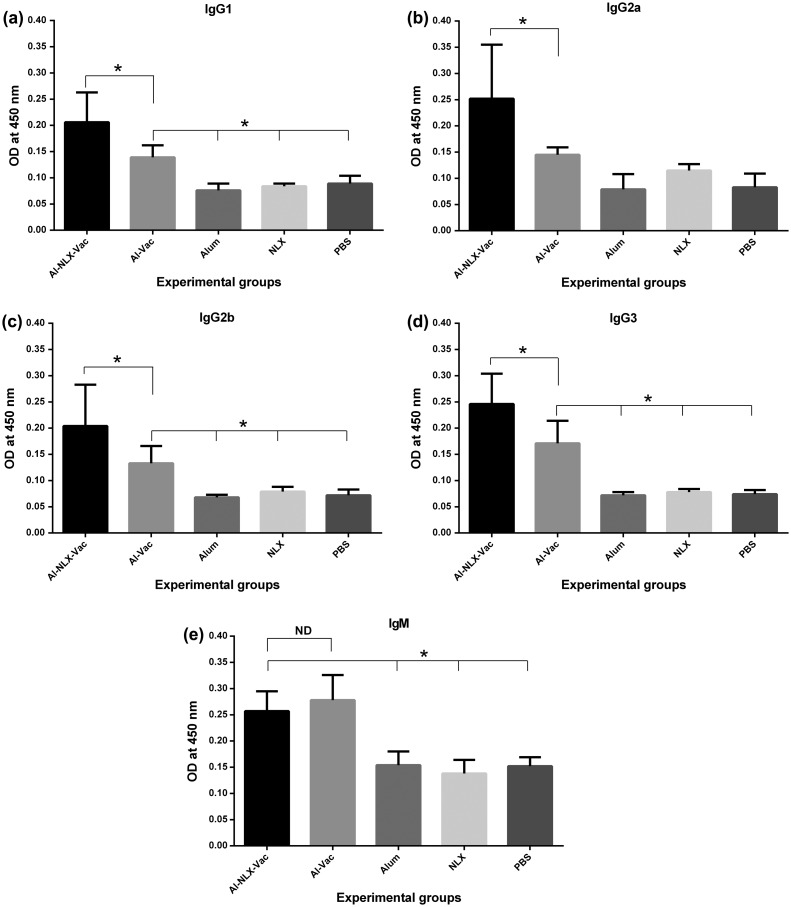
Figure 6.
Detection of IgG1 (a), IgG2a (b), IgG2b (c), IgG3 (d) and IgM, (e) specific antibodies. The measurements were made with sera of experimental mice, and the values represent the means of optical density ± standard deviation. Asterisks indicate the groups which were significantly different and ND indicates not detectable differences (p < 0.05).

