
Figure 10.
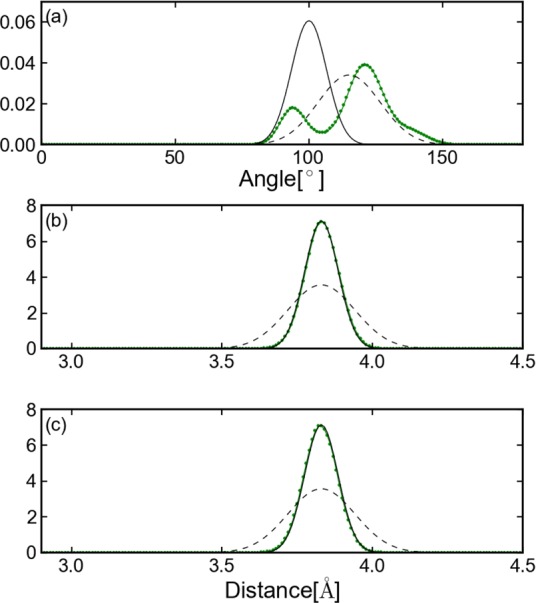
Distribution of distance and angles for Ala5. The green dotted line presents the distribution sampled from equilibrium MD. The black solid line presents the distribution defined by Ebond = 100 (r – 3.83)2, Eangle = 94.84 (θ – 100.0)2, and Edihedral = 0.1 (χ – 55.0)2. The black dotted line presents the distribution defined by Ebond = 400 (r – 3.83)2, Eangle = 30 (θ – 115.0)2, and Edihedral = 0.1 (χ – 55.0)2. Subplot a presents the angle between the carbon-α of residues 2, 3, and 4. Subplot b presents the distance between carbon-α of residues 2 and 3. Subplot c presents the distance between carbon-α of residues 3 and 4.