
Figure 12.
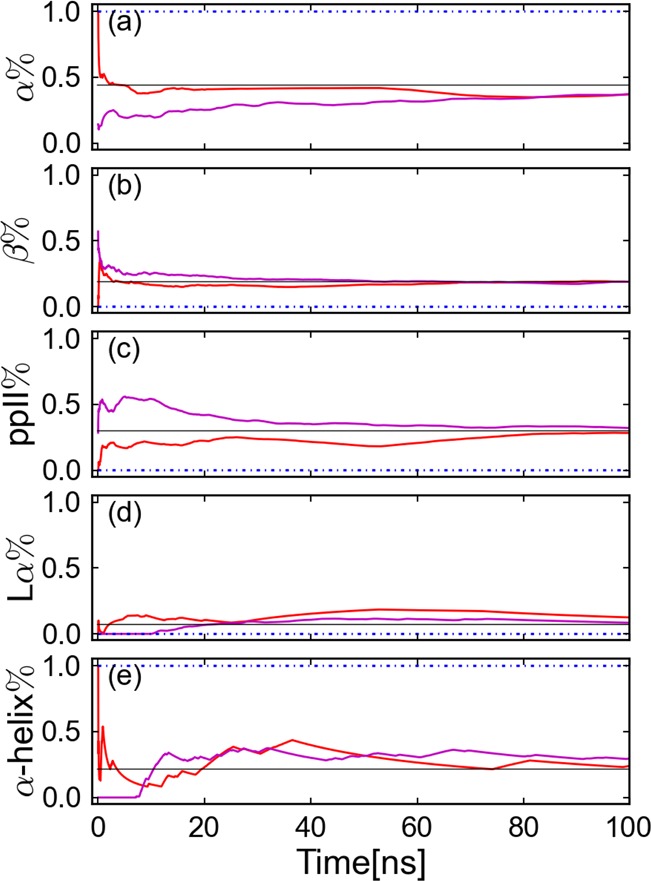
Evolution of the percentage of different conformations. The solid lines present the results from a CG-guided hybrid neMD-MC; the dashed lines are from equilibrium MD. The black solid line presents the reference percentage from Best et al.38 The red and blue lines present simulations where the initial structure has an α-helix (Figure 4, right); magenta β sheet (Figure 4, left). Subplots a–d present the percentage of α, β, ppII, and L-α. The average percentage of residues 6–10 is shown. Subplot e presents the percentage of the α-helix. The structure contains an α-helix secondary structure when three successive residues are in α conformation.