
Figure 8.
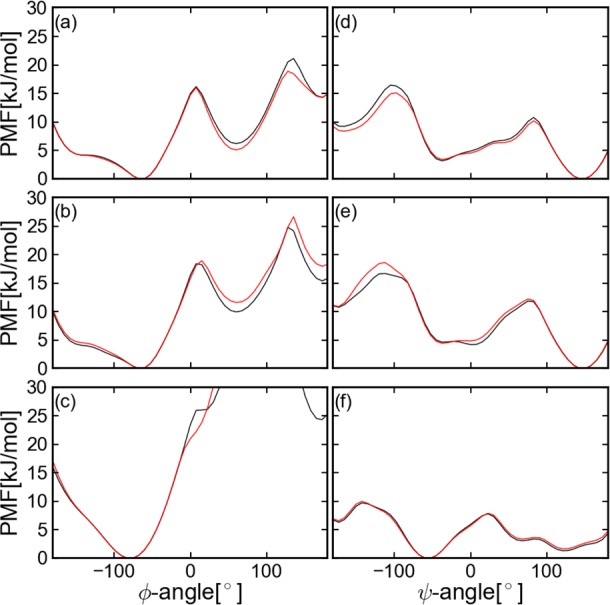
PMF along ϕ and ψ angles for Ala3. The black line presents the results from equilibrium MD and the red line from CG-guided hybrid neMD-MC. Subplots a and d present PMF along the ϕ and ψ angles of residue 1; b and e of residue 2; and c and f of residue 3. The lowest value for each PMF is always set to 0.