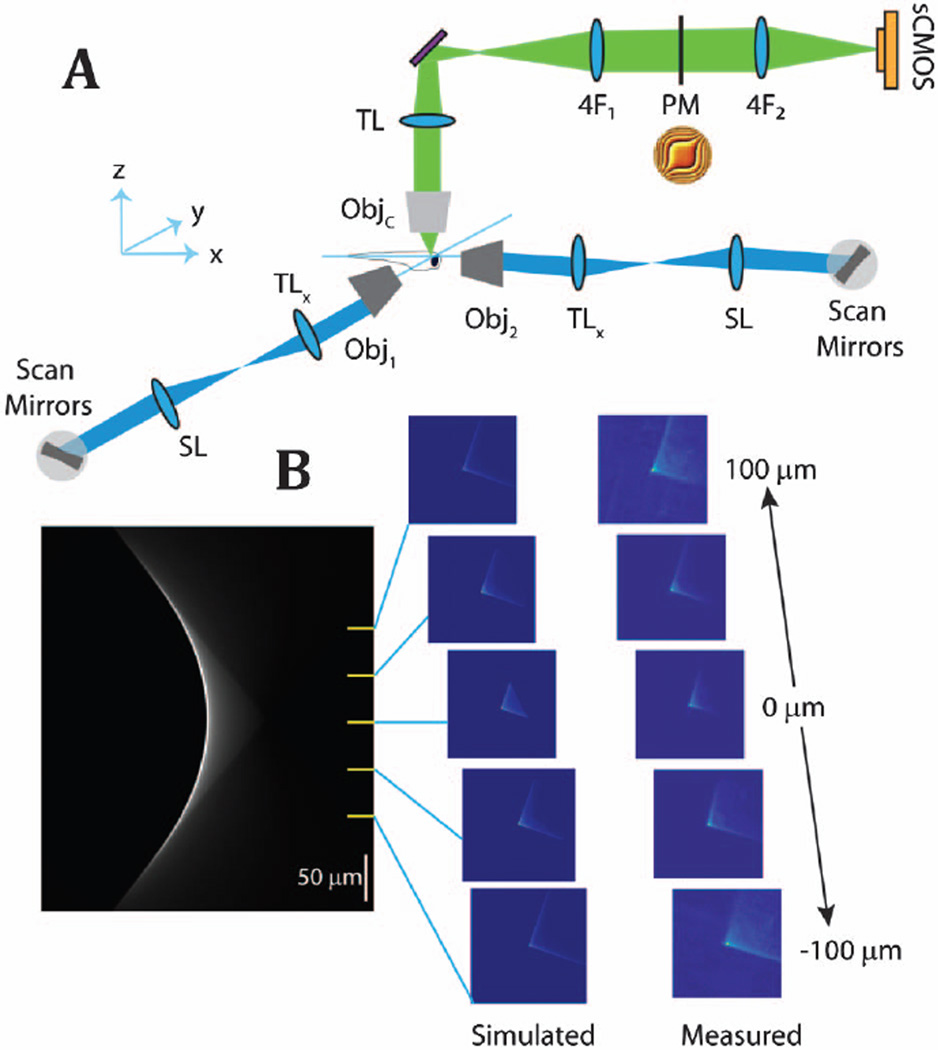
Fig. 1.
Schematic of the excitation and imaging path is shown in panel A. The axial dependence for this realization of the cubic-phase point spread function is shown in panel B. The left-most panel is the simulated x-z projection of the EDoF, and the right-most panel contains the experimentally acquired EDoF point spread functions.

