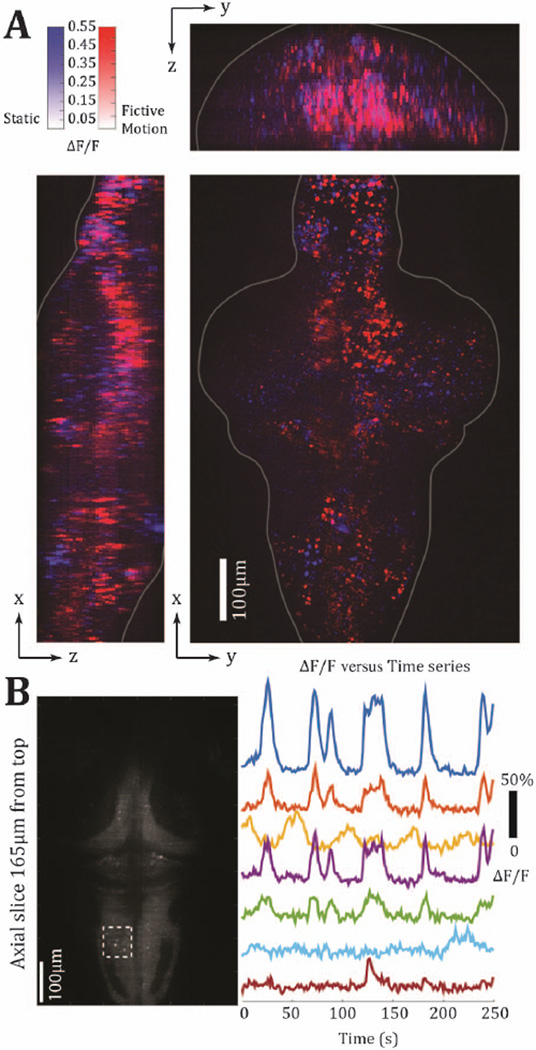
Fig. 3.
Demonstration of functional imaging capabilities after data restoration. Panel A shows maximum-intensity projections conveying the spatial specificity of neurons responding to visual motion. Panel B shows functional traces from seven example neurons from the region indicated by the dashed box.

