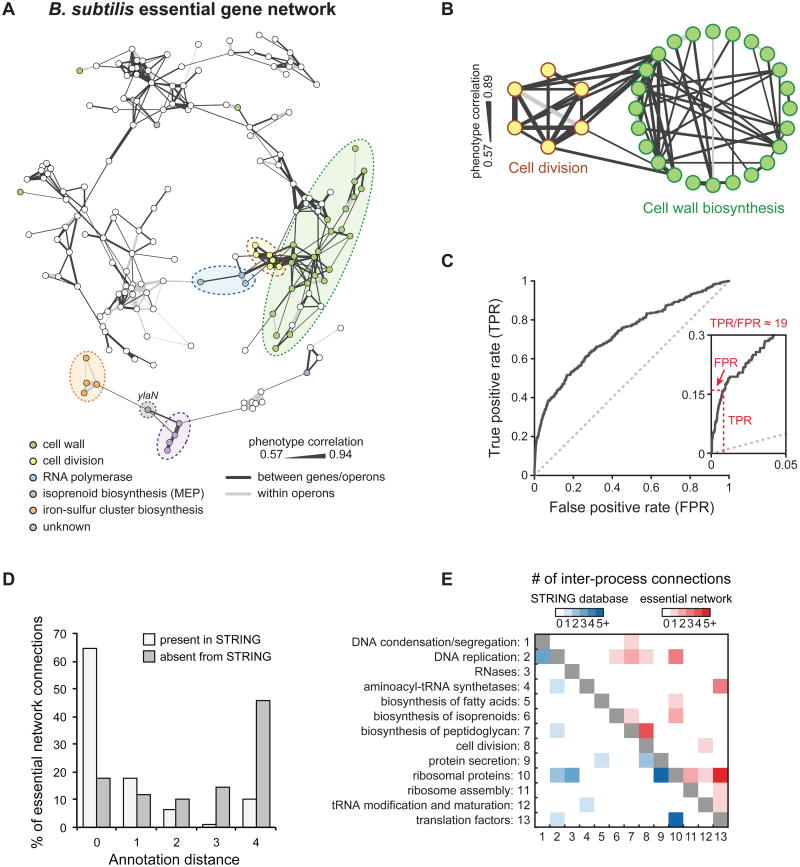
Figure 3. An Essential Gene Network Reveals Numerous Intra- and Inter-process Connections.
A) Essential gene network based on correlations between chemical-gene phenotypes. Edge thickness is proportional to the extent of correlation. See also Figure S3 for network gene names.
B) Intra- and inter-process connections between cell division and cell wall-biosynthesis genes. Genes outside the main network or genes lacking intra-process connections were excluded.
C) ROC curve comparing connections between essential operons in our network to the STRING database. True-positive connections are those present in the high-confidence set of interactions from STRING, and false-positive connections are absent from STRING (these connections may be either truly false or novel).
D) Annotation distance for network connections between essential operons present or absent from the STRING database. Genes with an annotation distance of 0 are from the same functional group, while genes with an annotation distance of 4 are unconnected by annotation.
E) Functional annotations for intra-process connections between essential operons present in the STRING database or present in our essential network.

