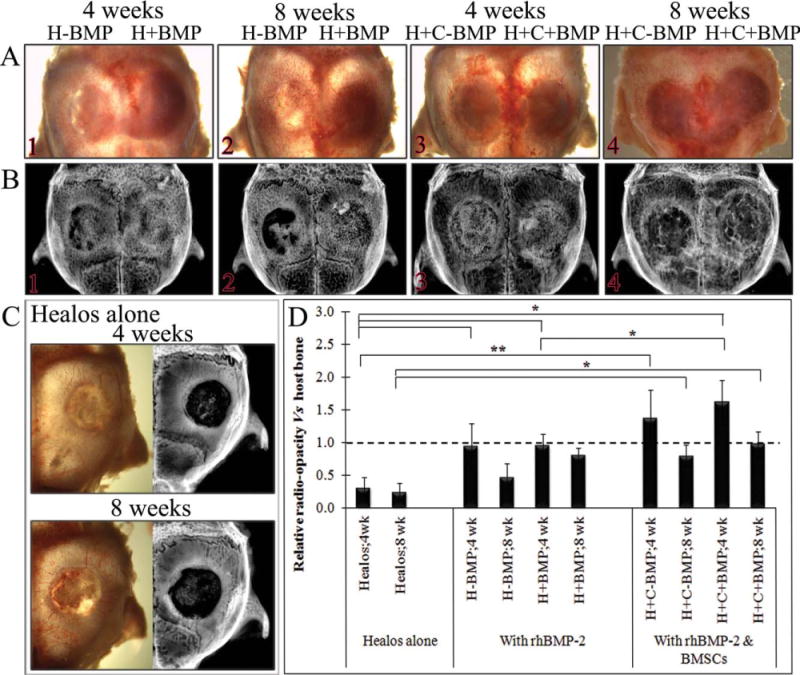
FIGURE 2.

Representative images of isolated calvaria showing (A) whole calvaia, (B) X-ray images of the tested groups at 4 and 8 weeks, (C) whole calvaria and X-ray images of Healos alone at 4 and 8 weeks, when neighboring defects did not contain rhBMP-2, and (D) quantification of new bone formation in terms of relative radio-opacity of defect site versus host bone. Statistical analysis was performed using t-test. Data represented as mean ± SD for n = 3, *p < 0.050; **p < 0.010. [Color figure can be viewed in the online issue, which is available at wileyonlinelibrary.com.]
