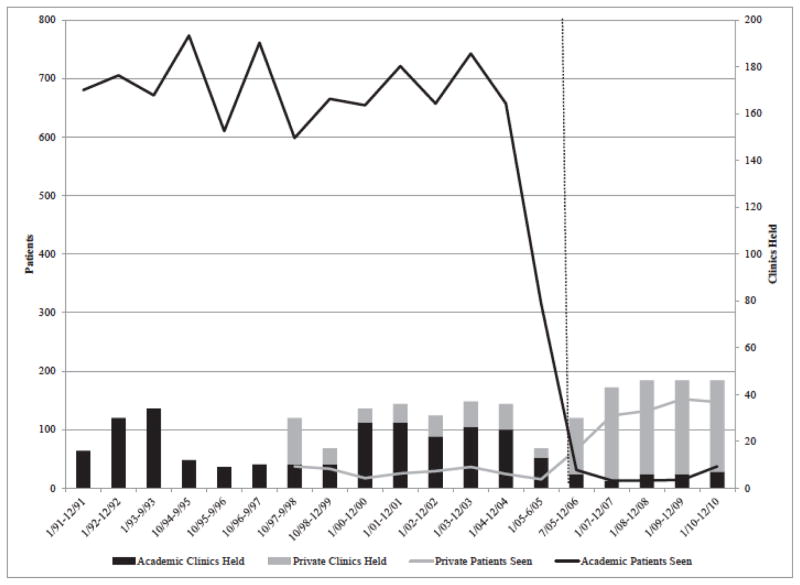
Figure 2.
Wisconsin Genetic Services Network Clinics Held and Patients Seen by Health System, 1991–2010
Note: Patients seen are plotted on the left vertical axis; clinics held are plotted on the right vertical axis. The vertical dotted line shows the change in lead contractor in July 2005. Data were reported by contract period, and contract periods are inconsistent. Academic Medical Center patients seen from 1/00–6/05 converts the reported number of families seen to individuals based on the rate of 2.67 individuals per family, which was extrapolated from the previous nine years, in which both individuals and families were reported.

