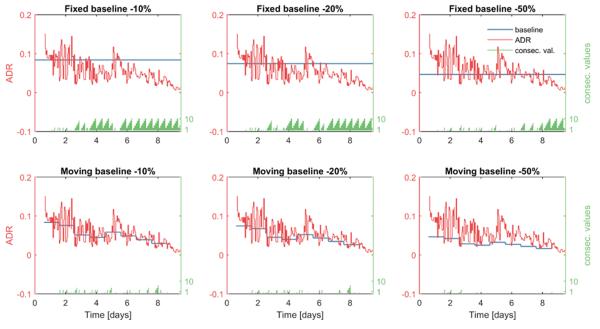
Figure 1.
ADR (red) from the left frontal region of one patient who developed DCI 9 days after SAH. One ADR value is calculated each hour. In the upper plots alarms are determined by comparing ADR values to a constant baseline (blue). In the lower plots alarms are determined by comparing ADR values to a moving baseline (blue). The alarm threshold is set to −10% in the leftmost panels, to −20% in the middle panels, and to −50% in the rightmost panels. The time in days (x axis) represents the time elapsed from the time of initial SAH. The number of consecutive baseline crossings (green) is reset to zero and starts over after exceeding a count of 10.

