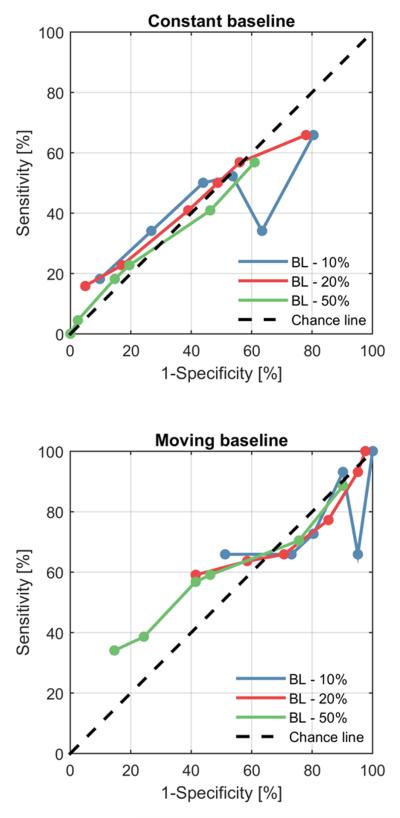
Fig. 2.
ROC points for the (A) constant baseline and (B) shifting baseline cases. 1-specificity against sensitivity. Each ROC curve includes 6 points, corresponding to different thresholds (0, 2, 4, 6, 8, 10) on the number of consecutive below-baseline values required to sound an alarm. The different colours represent the three different thresholds. Abbreviations: BL – 10%, alarm threshold is 10% below baseline; BL – 20%, alarm threshold set to 20% below baseline; BL – 50%, alarm threshold set to 50% below baseline.

