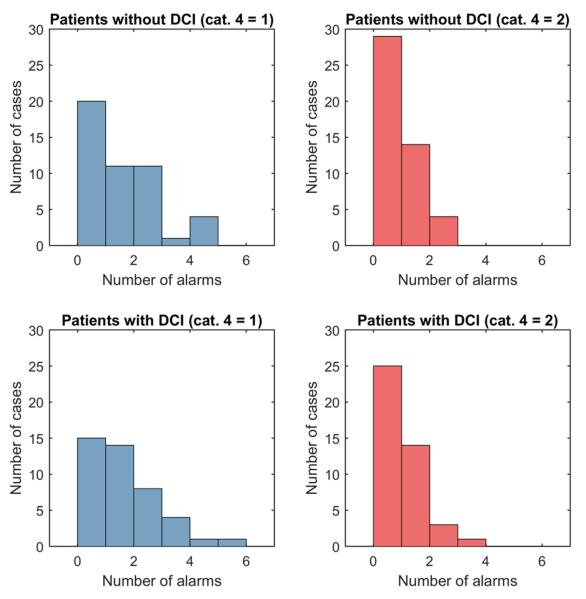
Fig. 4.
Histograms of number of alarms vs frequency of alarms. The upper histograms are for patients without clinically diagnosed DCI. The lower histograms are for patients with clinically diagnosed DCI. The left plots result from using option 1 for RAV = 4 and the right plots result from using option 2 (see Table 2).

