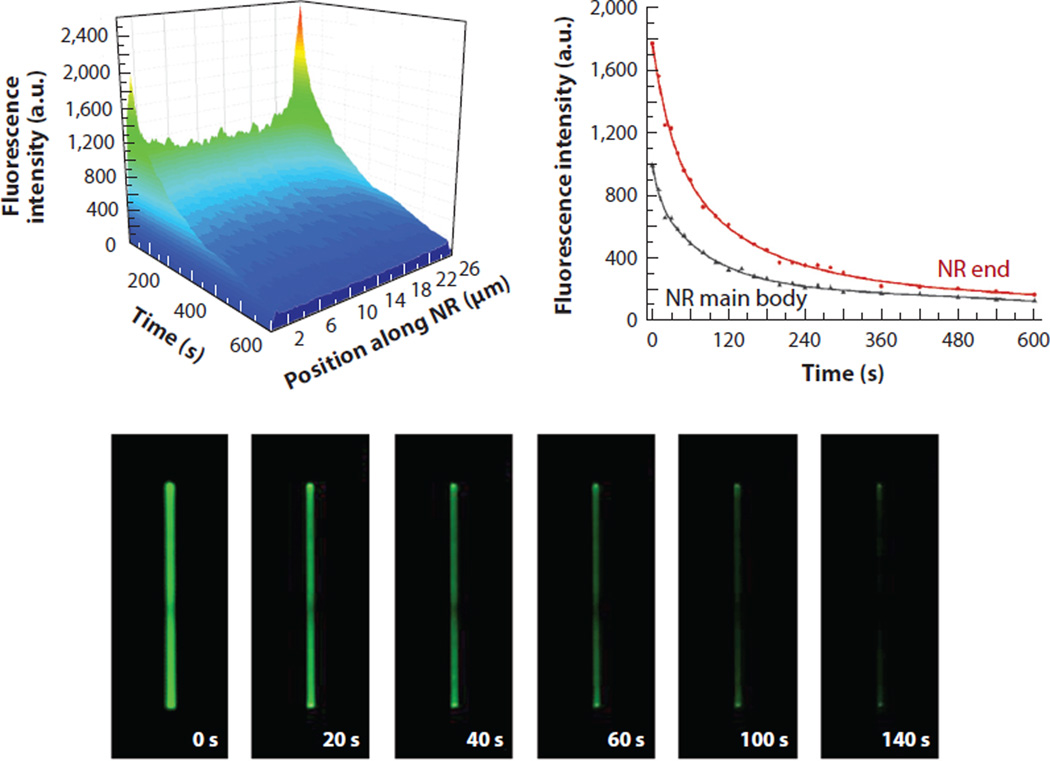
Figure 5.
Highly spatially localized, temporally extended biomolecular fluorescence signal observed on single ZnO nanorods (NRs). The contour map and the time-lapse images display variations in the biomolecular fluorescence intensity along the long axis of a 25-µm-long ZnO NR. Differences in the time dependence of the fluorescence intensity decay under constant irradiation were clearly observed depending on the ZnO NR planes. Red and black data show biomolecular fluorescence measured from the NR end and main body, respectively. Figure adapted from Reference 40 with permission. Copyright 2014 Royal Society of Chemistry.

