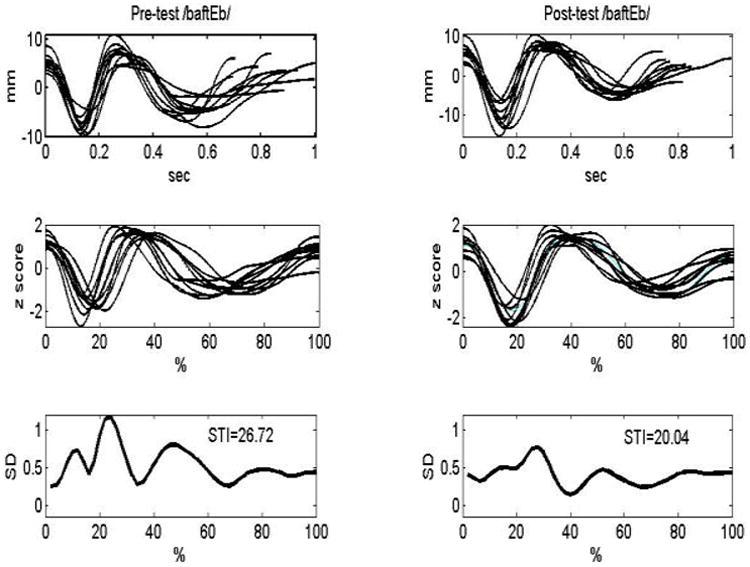
Figure 2.

These plots compare the STI analysis for one condition for one child in the pre-test (on the left) and in the post-test (on the right). The top left quadrant shows 10 trimmed tokens of the same form produced in the pre-test from one child. The plot below that on the left shows those trimmed productions, but now they are time and amplitude normalized. The bottom left quadrant shows the STI calculation. The plots on the right show the same child's productions in the post-test.
