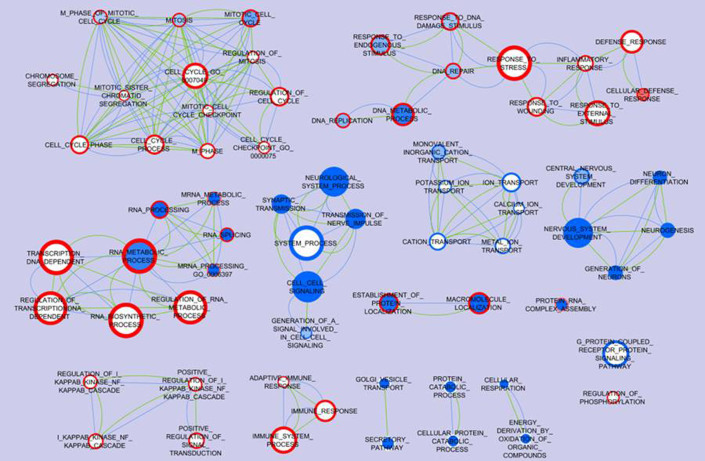
Figure 1. Biological processes associated with AD and GBM inversion.
Differentially expressed genes identified from each AD or GBM microarray dataset compared to the normal subjects control were performed gene set enrichment analysis (GSEA) for biological processes. Enrichment Map software was used to visualize the biological processes association between AD and GBM. Each node represents a gene ontology (GO) term, and all of the nodes pose GSEA p-value < 0.01 and FDR q-value < 0.25. The color tone in the face of the node represents the regulation in AD datasets: red means the genes are up-regulated while blue means the genes are down-regulated; meanwhile the color tone in the boundary of the node represents the regulation in GBM datasets. The actual color corresponds to the GSEA enrichment p-value: darker red or blue means this GO term is more enriched with differentially expressed genes, while white means the corresponding GO term is not enriched; e.g. the node Mitosis has a blue face color and dark red boundary color indicating high enrichment of down-regulated genes in the AD datasets and up-regulated genes in the GBM datasets. The edges indicate that the connected two nodes share at least 30% of genes, and the thicker edge represents a larger ratio of shared genes. The green edges represent the shared genes based on the annotation of AD datasets and the blue edges represent the shared genes based on the annotation of GBM datasets; e.g. DNA Metabolic process and DNA Replication share more than 30% genes in both the GBM and AD datasets.

