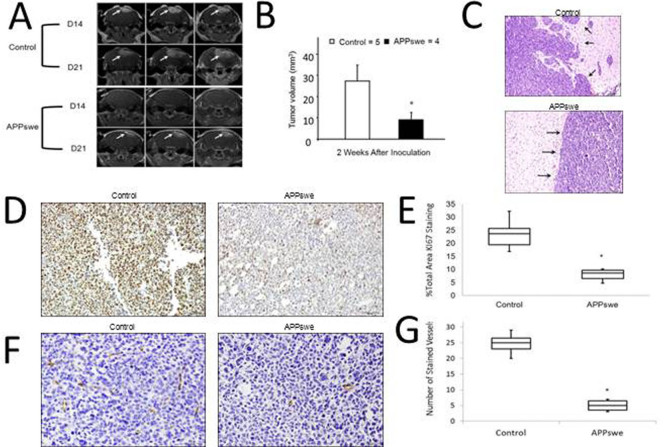
Figure 4. GBM growth in AD transgenic mice.
GL261 murine GBM cells were intracranially injected into 12-month old APPswe transgenic and litter-match wild-type mice. (A). Representative brain MRI images for 3 slices of each brain of the AD and control mice. Arrows indicate the tumor. (B). Tumor volume from week 2 was calculated from the MRI whole brain slices and data was presented as mean with SD. (C). Representative H&E images of tumor boundary in AD and control mice. Arrows indicate the tumor boundary regions. (D). Representative images of Ki67-positive proliferative cells in the brain tumors of AD and control mice (100×). (E). Ki67-positive cells (brown staining) were counted in 5 fields of 5 sections/mouse brain under 20× objective, and data was presented as % of Ki67-positive cells to the total cells. (F). Representative images of CD34-positive microvessels (brown staining) in the non-tumor area and tumor area of AD mice (200×). (G). CD34-positive microvessels were counted in 5 fields of 5 sections/mouse brain under 20× objective, and data was presented as mean with SD. *P < 0.05 vs. wild-type control. n = 4 for APPswe transgenic mice and n = 5 for litter-match wild-type mice.

