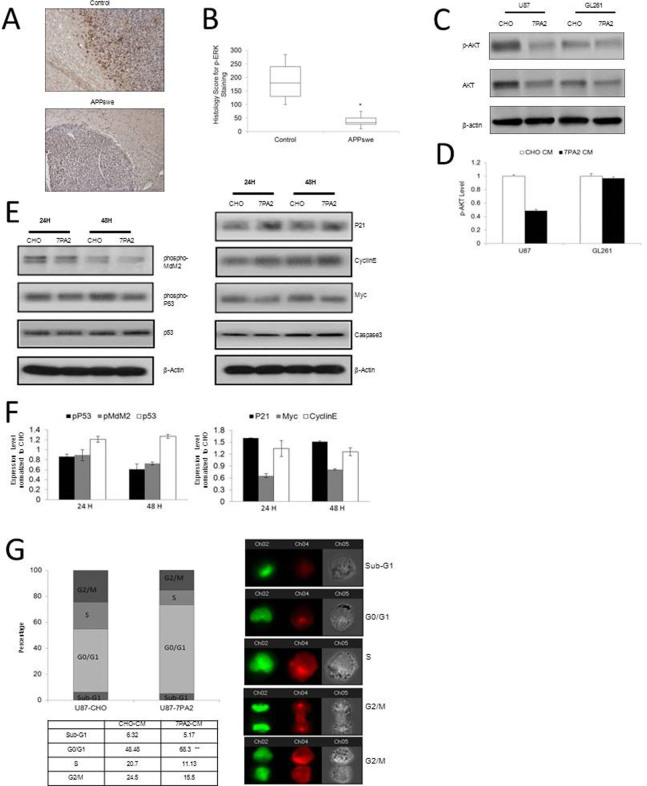
Figure 5. ERK1/2 and AKT signaling connecting AD and GBM.
(A). Representative images of p-ERK1/2 immuno-staining in the brain tumor margin area of AD and wild-type control mice (100×). (B). Quantification of the H scores for p-ERK1/2 immuno-reactivity. *P < 0.05 vs. wild-type control. n = 4 for APPswe transgenic mice and n = 5 for litter-match wild-type mice. (C–D). U87 and GL261 cells exposed to 7PA2-CM for 30 minutes were detected for pAKT expression. (E–F). Signaling proteins downstream to ERK1/2 and AKT in the U87 cells exposed to 7PA2-CM for 24 and 48 hours. (G). Cell cycle distribution of U87 cells exposed to 7PA2-CM for 24 hours. The in vitro quantification data were obtained from three independent experiments under the same condition. *P < 0.05 vs. CHO-CM. In all panels, western blots images shown are cropped to show the protein of interest, and all blots were performed under the same experimental conditions.

