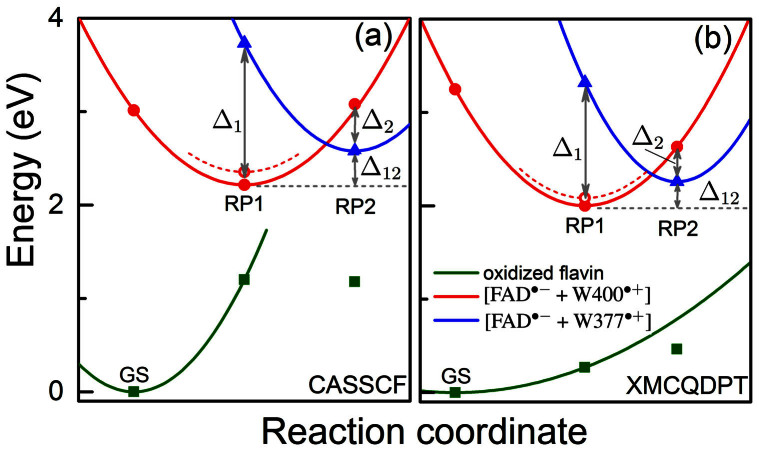
Figure 3. Potential energy profiles of the key electronic states in cryptochrome.
The energy for oxidized flavin is shown in green, for radical pair state [FAD·− + W400·+] in red and for radical pair state [FAD·− + W377·+] in blue. Solid symbols represent calculated energies, while lines represent schematic potential energy surfaces. The energies were computed using the CASSCF method (a) and the perturbation theory-based XMCQDPT-2 method (b). Open circles denote the energies calculated for the optimized [FAD·− + W400·+] radical pair after the rearrangement of the W377 residue shown in Fig. 4. Δ1 is the energy difference between the RP2 and the RP1 state calculated for the RP1-optimized geometry and Δ2 is the energy difference between the RP1 and the RP2 state calculated for the RP2-optimized geometry; Δ12 is the energy difference between geometry optimized RP2 state and geometry optimized RP1 state. The values of the energies Δ1, Δ2, Δ12, according to the data in Tab. 1, are 1.52 eV, 0.50 eV, 0.36 eV, respectively, for the CASSCF method and 1.32 eV, 0.38 eV, 0.26 eV, respectively, for the XMCQDPT-2 method.

