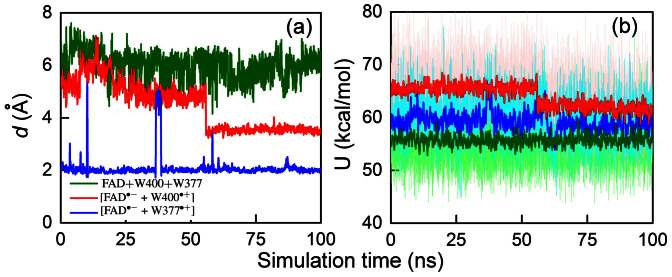
Figure 5. Spontaneous rearrangement of W377 seen in classical MD simulation.
(a) Time evolution of the distance d between the OG1 atom of the T404 residue and the HE1 atom of the W377 residue (see Fig. 4) calculated for cryptochrome with oxidized flavin, i.e., in the FAD + W400 + W377 state (green), cryptochrome in the radical pair state [FAD·− + W400·+] (red), and cryptochrome in the radical pair state [FAD·− + W377·+] (blue). (b) Total energy in Arabidopsis thaliana cryptochrome of the neutral W400…W377 diad (green), the diad with the W400·+ radical (red), and of the diad with the W377·+ radical (blue). The distances in (a) and the corresponding energies in (b) for the three redox states of cryptochrome are measured for the same MD trajectories. The energies calculated for each step of the simulation are shown with the shaded colors, while intense colors show energies averaged over 50 steps.

