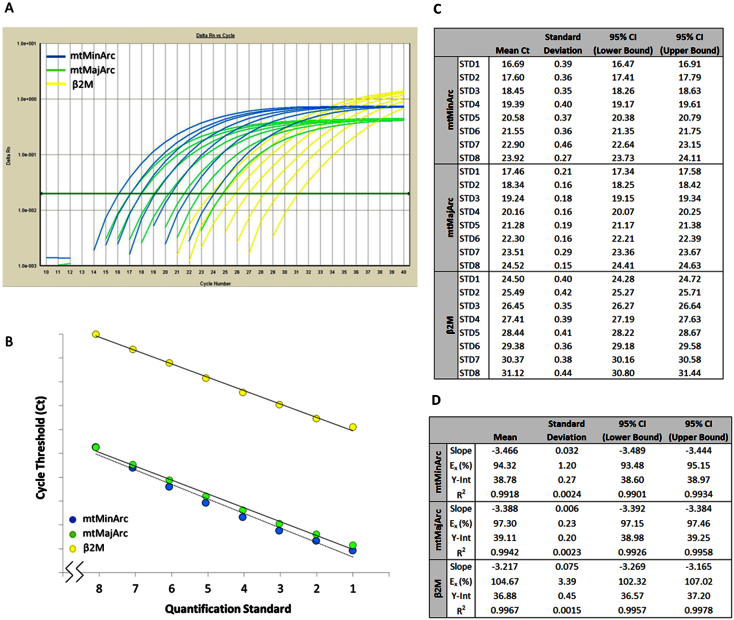
Figure 2. Standard curve reproducibility.
Panel A- A representative real-time amplification plot of the standard DNA dilution series. The green horizontal line indicates the manual Cq threshold set at 0.04. Panel B- A representative standard curve regression. Note that the Y-intercept (provided in the table) is a function of the concentration of the standards; however, since the data are plotted by quantification standard number, the Y-intercepts are misrepresented (denoted by the broken x-axis). Panel C- Descriptive statistics for sixteen replicate standard curves analyzed on eight separate runs. Panel D- Descriptive statistics for the slope, amplification efficiency (Ex), Y-intercept (Y-int.), and correlation coefficient (R2) for eight runs with the standard curve analyzed in duplicate. All three targets are optimized, as indicated by the high R2 value (≥0.99) and high amplification efficiency (>90%). CI, confidence interval.

