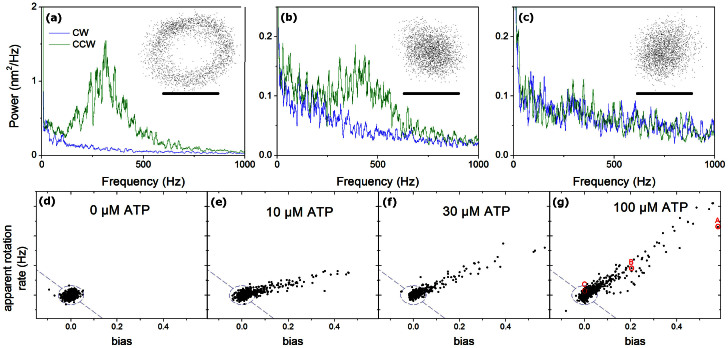
Figure 2. Example traces for F1 conjugated to neutravidin beads.
(A–C) Bead trajectory (inset, scale bar 40 nm) and rotational power spectrum (counterclockwise, CCW, in green, clockwise, CW, in blue), for three representative molecules at 100 μM ATP. Trajectories show rotation clearly in (A) only, power spectra show clear evidence for a unidirectional rotation peak in both (A) and (B). (D–G) Power spectral bias against mean apparent angular speed for many molecules at different ATP concentrations. Without ATP, data are centred on (0, 0). With ATP, CCW rotating appear at positive speed and bias. The beads shown in (A–C) are marked with red circles. A 4-sigma ellipse is drawn based on the no-ATP data, and the external region split into CW rotation (lower left) and CCW rotation (upper right). 99.5% of the 0 μM ATP beads lie within this circle (955/960). When ATP is added, 21%, 28% and 27% of beads are on the counter-clockwise side of these thresholds at 10, 30 and 100 μM ATP respectively, with 0%, 0.3% and 0.2% on the clockwise side. The fraction of beads with bias above zero is 50.2%, 79%, 83% and 77% in (D–G) respectively.

