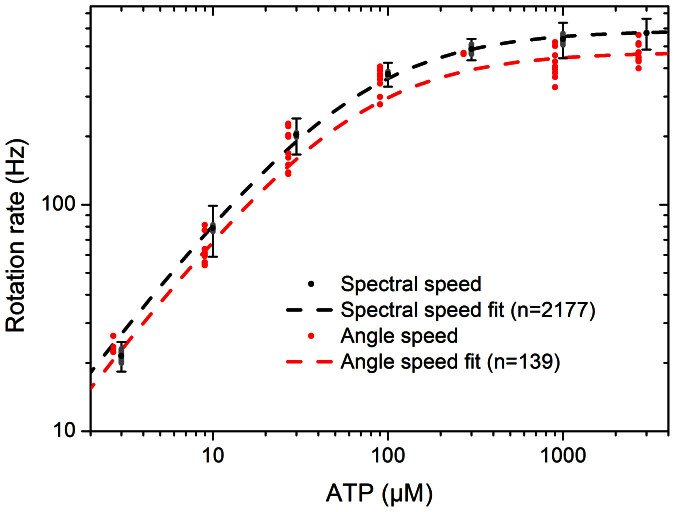
Figure 3. Rotation speed for wild type yeast F1 as a function of ATP concentration.
Black points and fit line shows data from fitting the power spectra of 2177 beads. Error bars mark the sample deviation of speeds at each ATP concentration, and grey bars mark the 95% confidence interval on the mean. Red points and fit line show speeds of 139 beads selected by eye for trajectories such as that of Fig. 2A, determined from bead angles, points offset horizontally for clarity. The discrepancy between fits is due to selection bias for slow beads in angle speed data; see SI for comparisons. Michaelis-Menten fits were calculated using Origin software.

