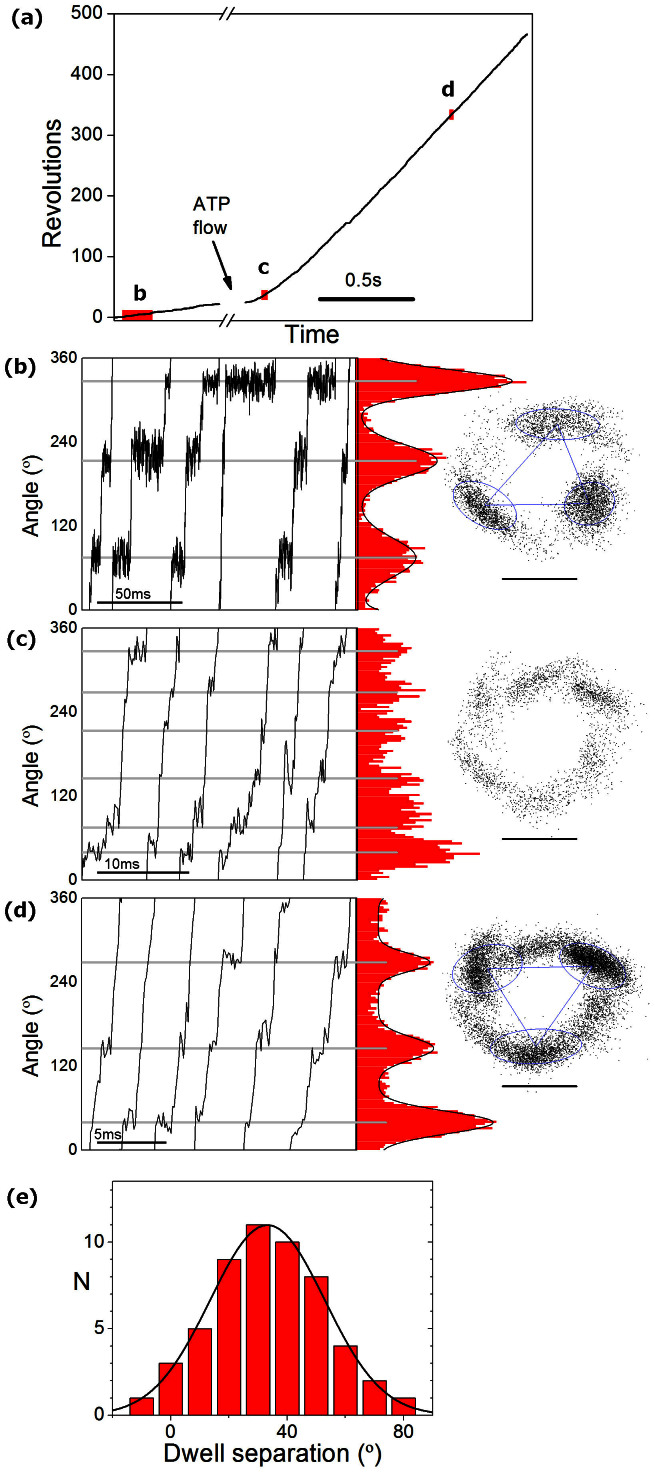
Figure 4. Dwells at low, intermediate, and saturating levels of ATP.
(A–D) One F1 molecule observed at low, intermediate and saturating levels of ATP. (A) Unwrapped angle vs time for the full record of this molecule: after recording for 0.6 s at a low ATP concentration (~5 μM), 3 mM ATP was introduced to the flow slide and a further 1.5 s record collected. All data were collected at 9 kHz. (B–D) Angle vs time for a few revolutions at the locations marked in (A), and angle histograms (red) and trajectories (right, scale bar 40 nm) collected (B) prior to ATP flow, (C) in the first 0.3 s recorded after flow began, (D) in the remainder of the trace (once speed was stable). The precise ATP concentration at any moment at time is not known. This molecule was tagged with a gold duplex, giving a very clear rotation signal. Angular separation between the dwells was measured using k-means clustering to determine the location of dwells at low and high ATP, and measuring the angle change between the vectors connecting dwell locations (blue triangle on x-y plots). (E) Histogram of 54 dwell angle separations observed from 18 molecules and least squares Gaussian fit to the histogram. The molecule shown in (A–D) produced atypically large angular deviations (48, 49, 64°), compared to population median of 31°.

