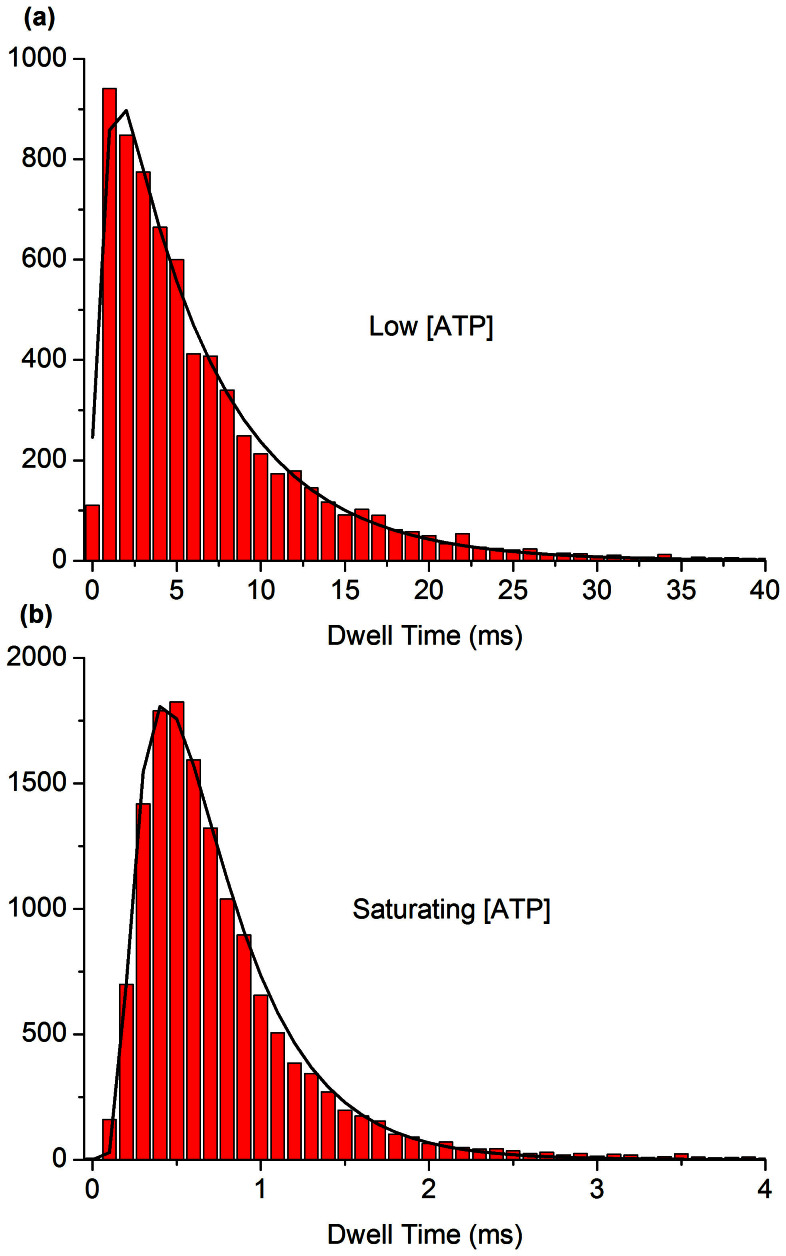
Figure 5.
Dwell distributions for a composite of 15 wild type F1 molecules at (A) low (10 μM) ATP and (B) saturating (3 mM) ATP. The low ATP data are fit by two sequential Poisson processes, saturating ATP by two sequential Poisson processes with a time offset. The values for the kinetic rates and time offset from the fits of the composite dwell distributions agree with the kinetic rates and time offset calculated from the median values of single molecule fits within the 95 percent confidence intervals.

