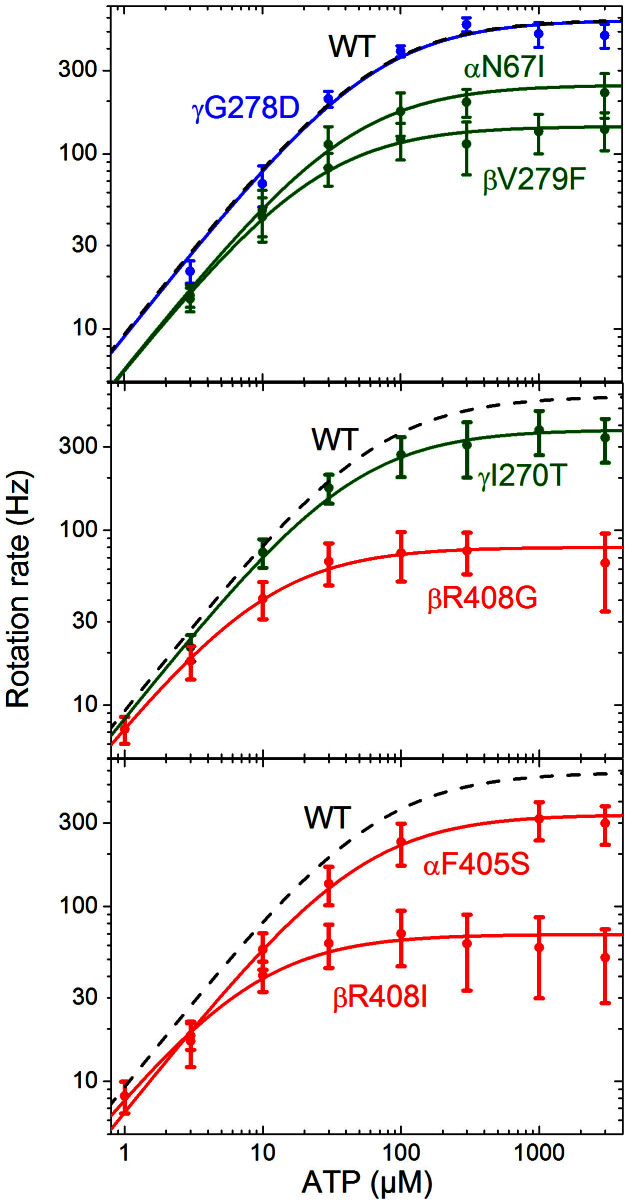
Figure 6. Rotation rate as a function of [ATP], for seven mutant forms of yeast F1, and associated Michaelis Menten fits (solid lines) for contrast to the wild type fit (grey dashed line) from Fig. 3.
Class 1 mutations are shown in green, Class 2 mutations in red, with classes assigned according to crystal structures. Thin error bars mark the standard deviation of observed speeds; fat bars mark the 95% CI on the mean speed (in some cases these are too small to observe). Michaelis-Menten fits were calculated in Origin.

