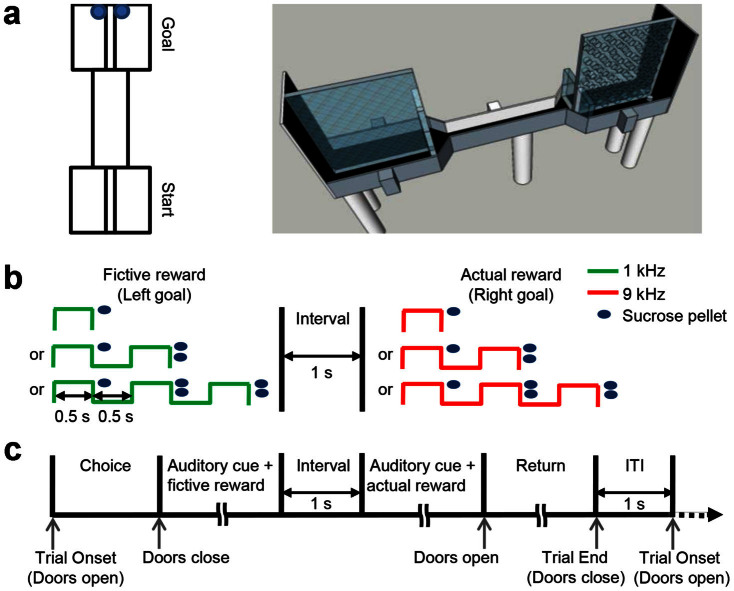
Figure 1. Behavioral task.
(a) A top-down view (left) and a three dimensional drawing (right) of the maze. (b) Schematic diagram showing auditory cues (one, two or three tones; left goal, 1 KHz; right goal, 9 KHz) and associated magnitudes of reward (total one, three or five sucrose pellets, respectively) delivered at the left and right goals. One sucrose pellet was delivered after the first tone, and two pellets were delivered after each additional tone for reward magnitude 3 and 5. (c) Temporal sequence of the task. ITI, inter-trial interval.

