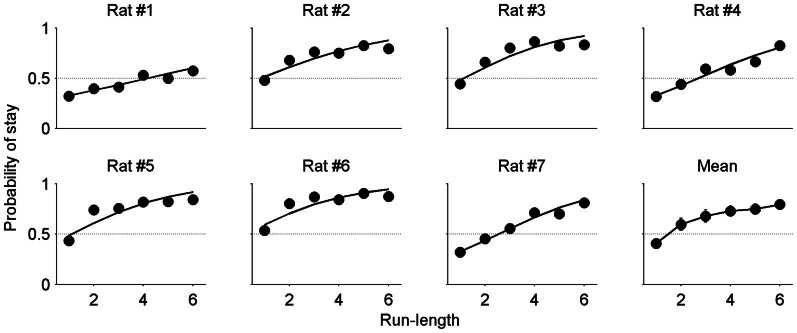
Figure 4. Dependence of stay choice on run-length.
The probability to stay (Pstay) was plotted as a function of run-length (the number of consecutive choices of the same goal) for each animal. Each data point was calculated using the choice data across all sessions for a given animal. The lines for individual animals (Rat #1–7) were determined by logistic regression relating animal's choice and run-length. The animals tended to repeat the same goal choice as run-length increased. Mean, Pstay values were averaged across animals (mean ± SEM; error bars are too small to see for some data points).

