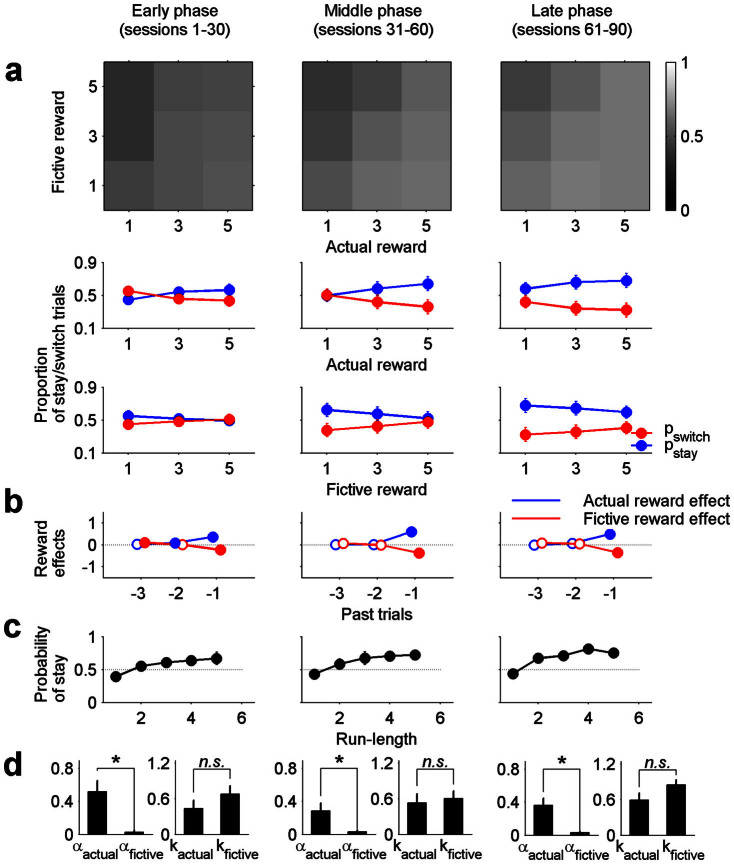
Figure 6. Effects of actual and fictive reward magnitudes on the animal's choice behavior in different phases.
The entire behavioral data (90 sessions) were divided into three phases (early, middle and late) and the same analyses used in Fig. 2–5 were applied to each phase. Shown are values averaged across the animals. (a) Same formats as in Fig. 2. (b) Same formats as in Fig. 3. (c) Same formats as in Fig. 4. (d) Same formats as in Fig. 5.

