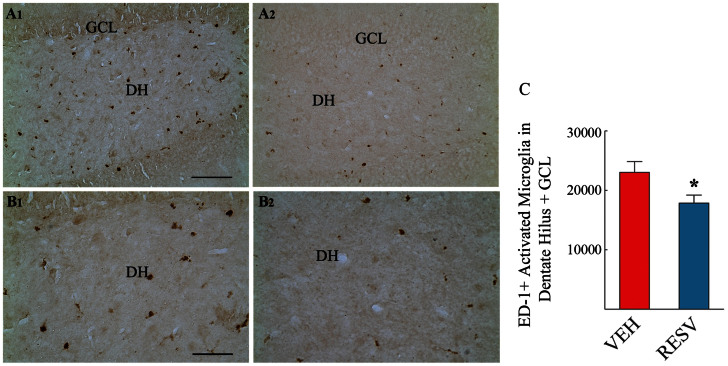
Figure 9.
Distribution of ED-1 (CD68)-positive activated microglia in the dentate hilus (DH) and granule cell layer (GCL) of vehicle (VEH, A1) and resveratrol (RESV, A2) treated groups. (B1 and B2) are magnified views of dentate hilar regions from A1 and B2. The bar chart in C compares numbers of ED-1+ activated microglia between VEH and RESV treated rats (n = 6/group). Values represent means and standard errors. Note that, the RESV treated group exhibited decreased numbers of ED-1+ activated microglia than the VEH treated group (p < 0.05, two-tailed, unpaired Student's t-test). Scale bar, (A1–A2), 100 μm; (E1–E2), 50 μm. *, p < 0.05.

