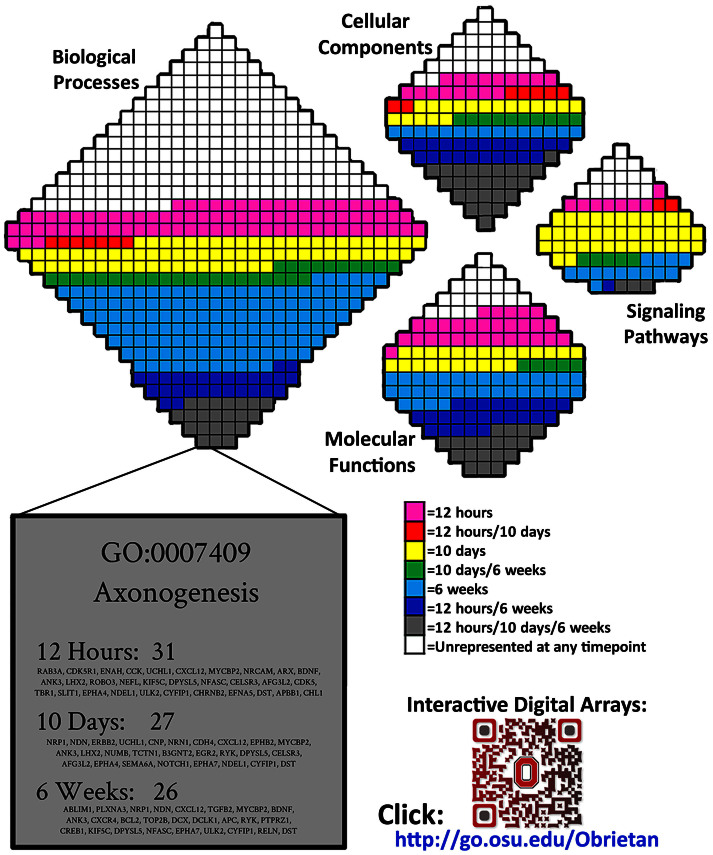
Figure 2. Functional profiling of upregulated genes.
DAVID categories of upregulated genes were arranged into functional arrays to illustrate the proportions of four ontological domains (‘Molecular Functions’, ‘Cellular Components’, ‘Biological Processes', and ‘Signaling Pathways') dominated by each phase of epileptogenesis. Each category is represented by a single square, and the color of the square denotes whether, and when, its expression profile was affected following SE (using the color scheme established in Figure 1D). An interactive digital version of this figure that details each category is available in Supplemental Fig. 3 (Chrome web browser or iPad tablet recommended for greatest compatibility). A single square (GO:0007409 Axonogenesis), has been magnified and presented as an example here. Each square contains the total number of genes upregulated at each time point, followed by the names of those genes. In Supplemental Fig. 3, each square can be zoomed in to view its ontological term, as well as the names of all the genes upregulated in that category at each timepoint. The total number of upregulated genes at each timepoint is also provided. Genes upregulated at 6-weeks showed the broadest range of biological processes. In contrast, expression changes at the two earlier time points had more a focused range of processes. Relatively little overlap in function was observed between time points. http://obrietanlab.org.ohio-state.edu/.

