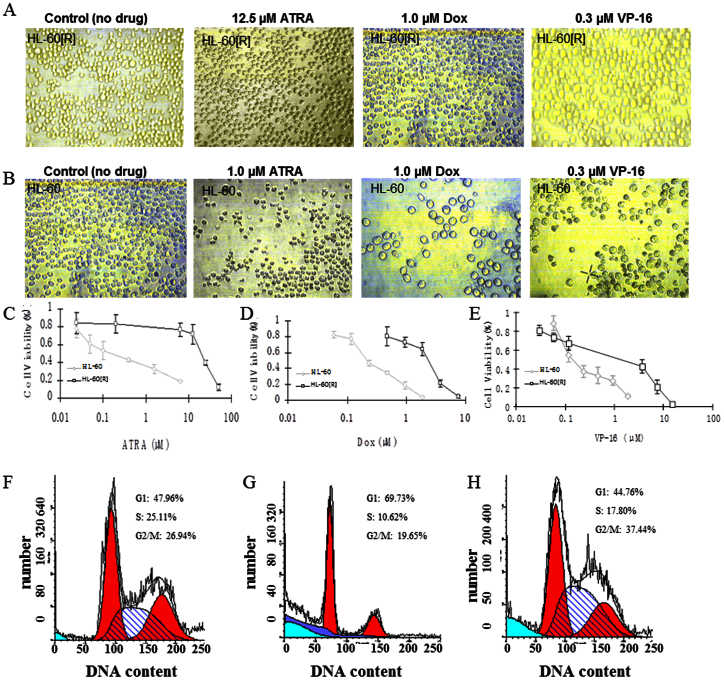
Figure 1. Cytotoxicity and flow cytometry analysis of HL-60[R] and HL-60 cells treated with 3 drugs (ATRA, doxorubicin [Dox], and VP-16).
(A) HL-60[R] cells treated with 12.5 μM ATRA, 1.0 μM doxorubicin, and 0.3 μM VP-16. (B) HL-60 cells treated with 1.0 μM ATRA, 1.0 μM doxorubicin, and 0.3 μM VP-16. Percentage of HL-60 and HL-60[R] cell viability after ATRA (C), doxorubicin (D), and VP-16 (E) treatment, as determined by MTT assay. Flow cytometry analysis of the effect of ATRA on the cellular DNA content of HL-60 and HL-60[R] cells. (F) HL-60 cells without ATRA. (G) HL-60 treated with 1.0 μM ATRA. (H) MDR HL-60[R] cells maintained in 1.0 μM ATRA.

