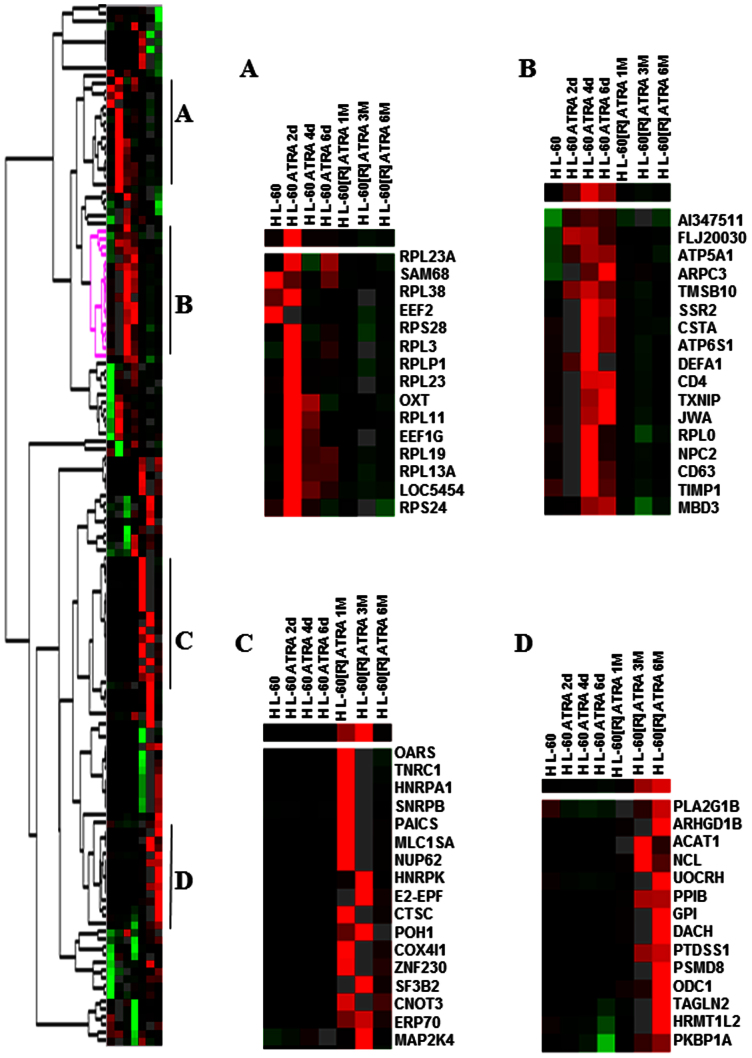
Figure 3. Cluster image demonstrating different classes of gene expression profiles in HL-60 and HL-60[R] cells after ATRA treatment.
We selected 210 genes whose RNA levels changed in response to 1.0 μM ATRA in HL-60 and HL-60[R] cells. (A) Cluster genes for which mRNA levels peaked at day 2 of ATRA treatment; (B) cluster genes that were expressed maximally at day 4 or day 6 of ATRA treatment; (C) cluster genes for which mRNA levels increased the ATRA treatment at 1 month, 3 months, or 6 months; and (D) cluster genes for which mRNA levels increased gradually over the ATRA treatment time course and were expressed maximally at 6 months.

