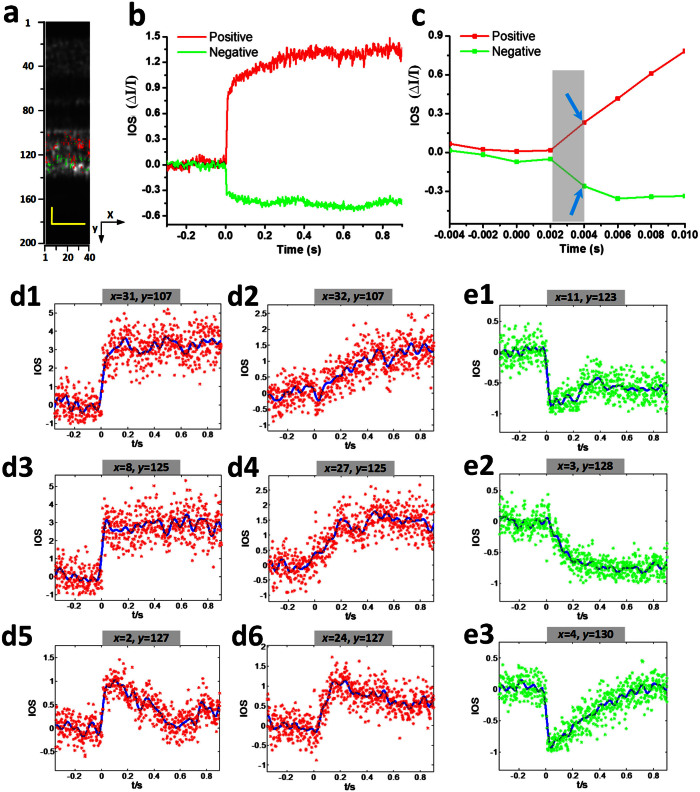
Figure 4. Spatiotemporal characteristics of fast IOSs with a 10 ms flash stimulus.
Raw OCT images were collected with a frame rate of 500 Hz. Stimulus onset is indicated by time “0”. (a) The OCT B-scan image consisted of 40 pixels (lateral) × 200 pixels (axial), corresponding to 60 μm (lateral) × 360 μm (axial). Illustrated OCT B-scan images are displayed with a linear scale. The IOS distribution map is superimposed on the OCT B-scan image. (b) Temporal curves of the averaged positive and negative IOSs. (c) To better visualize the IOS onset times, an enlarged profile of the early 14 ms period is illustrated. (d1–d6) Positive IOSs of individual pixels; both raw data (labeled with a star in red) and fitted curves (in blue) are shown. d1 (x = 31, y = 107) and d2 (x = 32, y = 107) were selected from the same axial location at adjacent locations in a lateral direction. d3 (x = 8, y = 125) and d4 (x = 27, y = 125) share the same axial location but with different lateral positions. d5 (x = 2, y = 127) and d6 (x = 24, y = 127) also share the same axial location but with different lateral positions. (e1–e3) Negative IOSs of individual pixels; both raw data (labeled with a star in green) and fitted curve (in blue) are shown. e1 (x = 11, y = 123), e2(x = 3, y = 128) and e3 (x = 4, y = 130) are from different locations. Scale bars indicate 25 μm.

