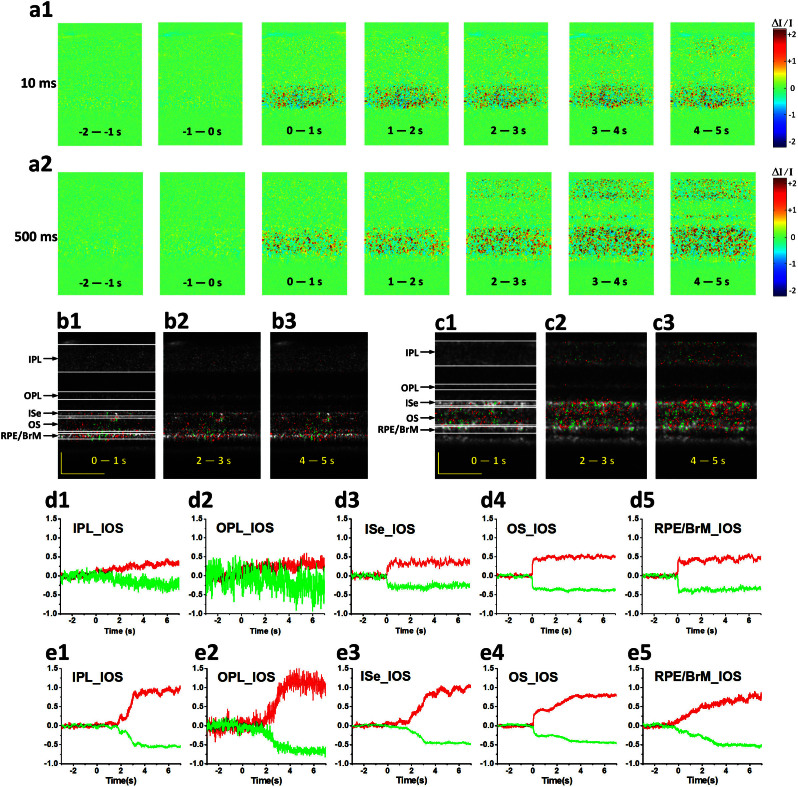
Figure 5. Spatiotemporal characterization of functional OCT-IOS imaging with prolonged recording times.
OCT B-scan images were collected with a frame rate of 100 Hz. (a1–a2) Spatial IOS image sequence averaged over 100 frames (1,000 ms interval) with 10 ms stimulation and 500 ms stimulation. OCT B-scan image and OCT-IOS images at 0–1 s, 2–3 s and 4–5 s with 10 ms stimulation (b1–b3) and 500 ms stimulation (c1–c3). The corresponding individual temporal curves of averaged positive and negative IOSs from the IPL, OPL, ISe, OS and RPE/BrM with 10 ms stimulation (d1–d5) and 500 ms stimulation (e1–e5). Scale bars indicate 50 μm.

