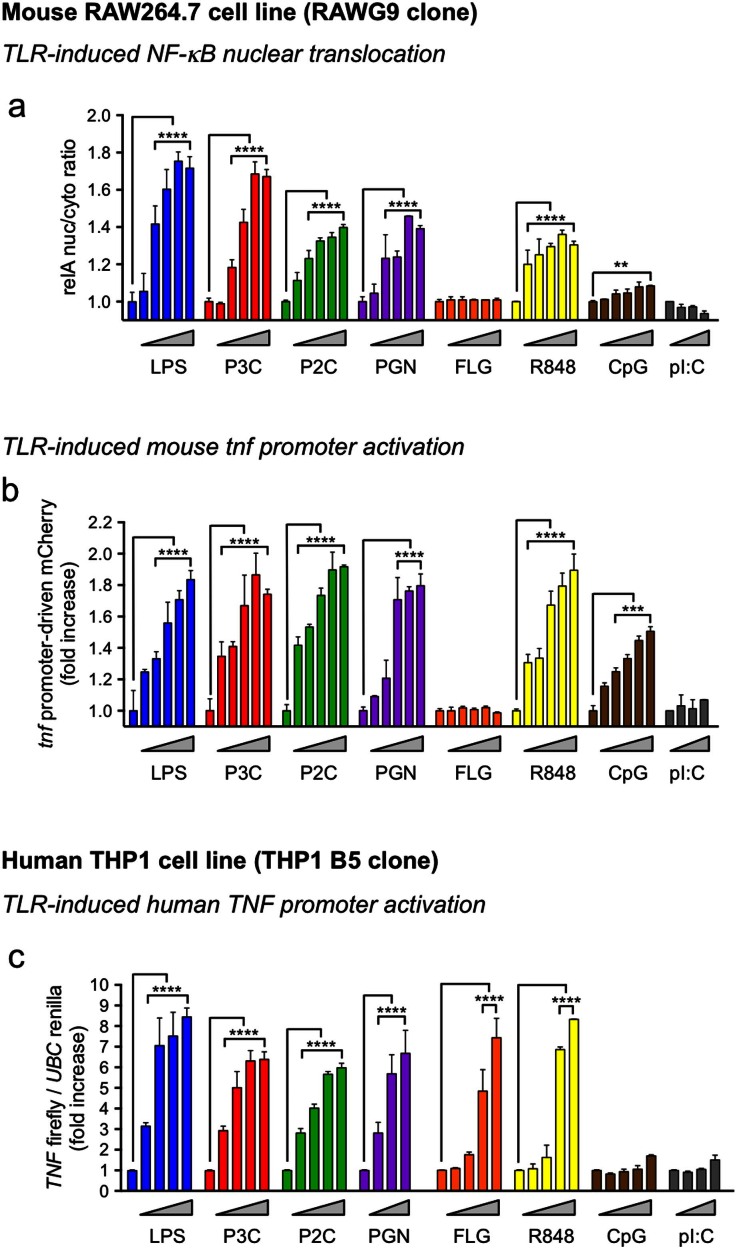
Figure 2. TLR ligand dose responses in mouse and human macrophage reporter cell lines.
(a + b) Dose response of (a) cytosol-to-nuclear translocation of the GFP-relA fusion at 30 min (120 min for CpG) and (b) tnf promoter-driven mCherry expression at 12 hr after treatment of RAW G9 cells with LPS (0, 0.5, 1, 5, 12.5 and 25 ng/ml), P3C (0, 62.5, 125, 250, 500 and 1000 nM), P2C (0, 7.8, 31.25, 62.5, 125 and 250 nM), PGN (1, 15, 37.5, 75, 150 and 300 ng/ml), FLG (0, 0.1, 1, 10, 100 and 1000 ng/ml), R848 (0, 0.37, 0.75, 1.5, 3 and 6 μM), CpG (0, 0.35, 0.7, 1.4, 2.8 and 5.6 μg/ml) or pI:C (0, 12.5, 25 and 50 μg/ml). (c) Dose response of the TNF firefly/UBC renilla luciferase expression ratio in THP1 B5 cells at 4 hr after treatment with LPS (0, 0.1, 1, 10 and 100 ng/ml), P3C (0, 1, 10, 100 and 1000 nM), P2C (0, 0.1, 1, 10 and 100 nM), PGN (0, 1, 10 and 100 μg/ml), FLG (0, 1, 10, 100 and 1000 ng/ml), R848 (0, 0.1, 1, 10 and 50 μg/ml), CpG (0, 1, 10, 100 and 1000 nM) or pI:C (0, 1, 10 and 100 μg/ml). Data are representative of three experiments (a–c; mean + s.d.). **P < 0.01, ***P < 0.001, ****P < 0.0001 (two-tailed t test).

