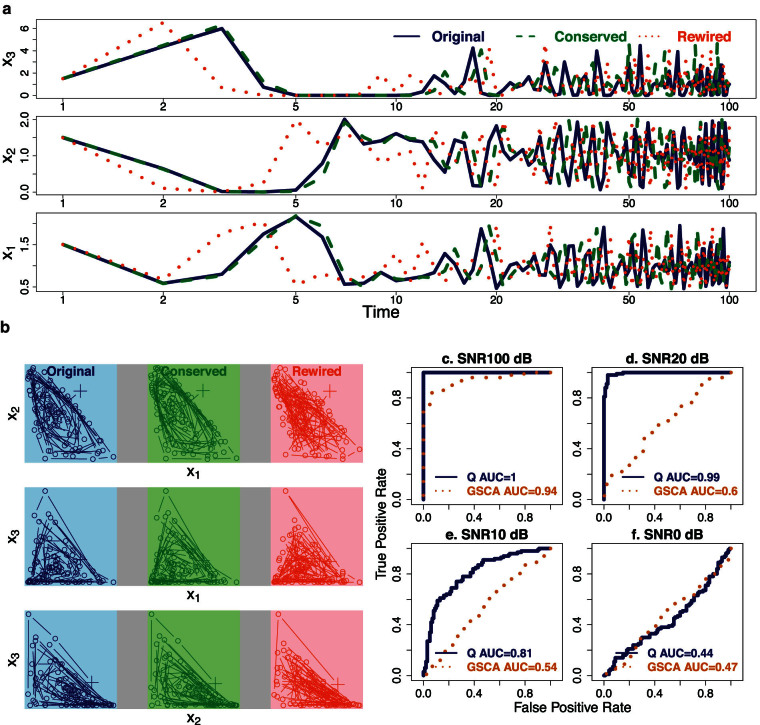
Figure 4. Advantage of the Q-method on differentiating chaotic dynamical systems.
Responses can be divergent with both conserved and rewired versions of a 3-variable chaotic Lotka-Volterra model. (a) The time courses are almost noise-free at an SNR of 100 dB. Reponses of the rewired model (orange dots) diverged from the original (blue solid lines) at the time of about 3; the time course of the conserved model (green dashes) is similar to the original at early time points but also diverged around time 15. The original and the rewired LV models start at the initial state of (1.500, 1.500, 1.500). The rewired model has changed parameters from the original model. The conserved model starts at (1.504, 1.510, 1.509). (b) Phase planes demonstrate chaotic dynamic behavior of the 3-variable Lotka-Volterra model. Each group of three phase planes in one grey box is for one pair of variables in the rewired (red), conserved (green), and original (blue) models. “+” marks the initial state. Most trajectories appear to differ substantially. This presents a major challenge to most pathway analysis methods not based on rate of change. (c–f) The four plots show ROC curves and their AUCs of the Q-method and GSCA on comparing the 100 rewired and 100 conserved Lotka-Volterra models at SNRs of (c) 100, (d) 20, (e) 10, and (f) 0 dB. The true positive rate is the ratio of correctly detected rewired models over all truly rewired models. The false positive rate is the ratio of incorrectly detected rewired models over all truly conserved models. Although the performance of both methods deteriorate as noise increases, differences in the AUCs again suggest a remarkable advantage of Q-method over GSCA.

