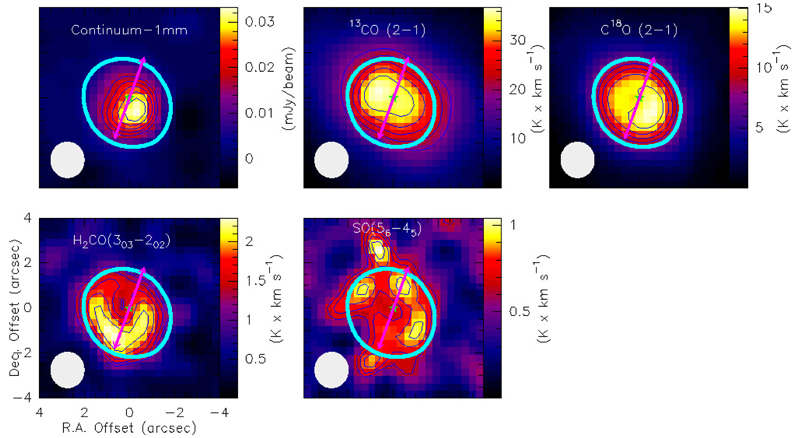
Fig. 1.
NOEMA images of the circumstellar disk around AB Aur. The 1mm continuum dust emission map, and the velocity-integrated intensity images from 3.5 to 8 km s−1 of the 13CO J=2 →1, C18O J=2 →1, SO J=56 →45, and H2CO J=303 →202 lines. White ellipses in the bottom left corner of each panel represents the beam size (~1″.6×1″5). Contour levels are 50% to 90% in steps 10% of the maximum value (34 mJy beam–1 for the continuum, 37 K × km s−1 for the 13CO J=2→0, 15 K × km s−1 for the C18O J=2→0, 2.3 K × km s−1 for the H2CO J=30,3 → 20,2, and 1.0 K × km s−1 for the SO). The thick blue contour indicates the 50% level of the C18O emission. The arrow shows the direction of the ionized jet (Rodríguez et al. 2014).

