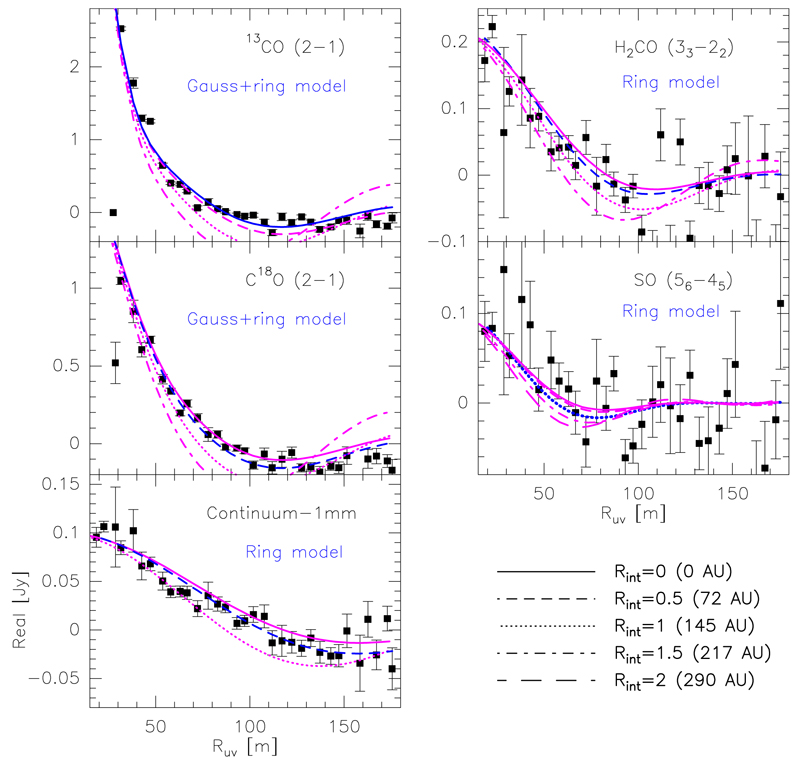
Fig. 3.
Real part of the observed visibilities as functions of uv distance of the dust emission and the 13CO J=2→1, C18O J=2→1, SO J=56→45, H2CO J=303 →202 lines. Blue lines represent the best fit models given in Table 2. Magenta lines represent the same models, but varying the inner radius from 0 to 2 arcsec in steps of 0.5.

