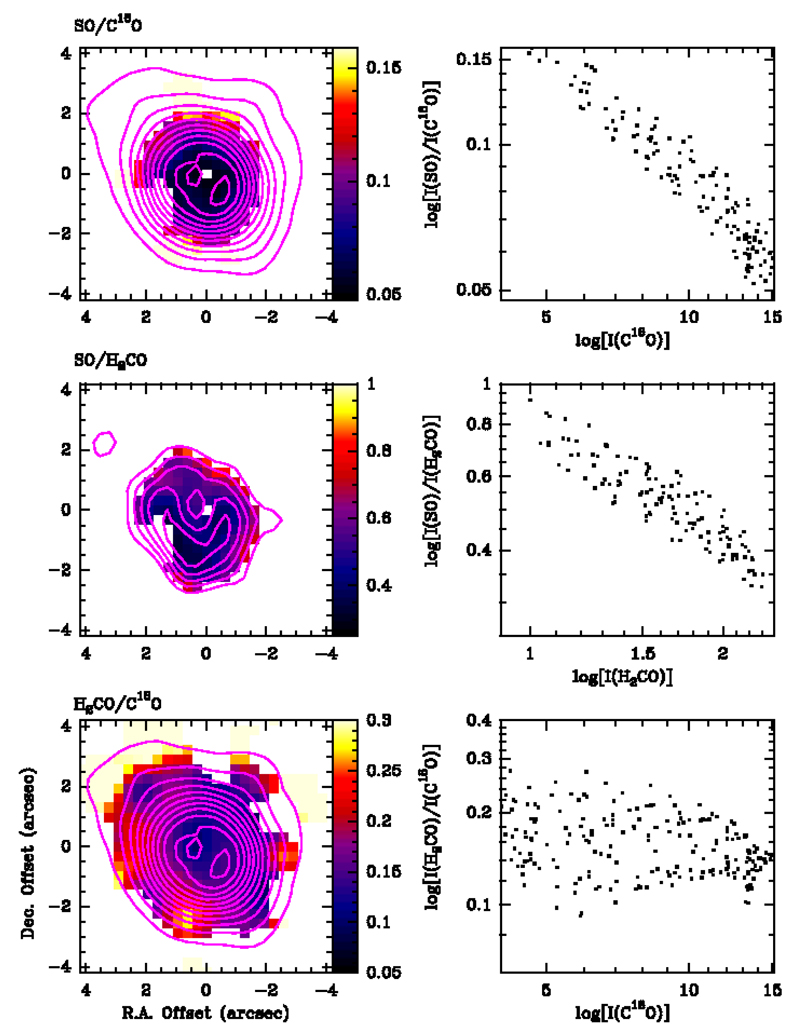
Fig. 5.
Line integrated intensity ratios. The color maps correspond to I(SO J=56→45)/I(C18 O J=2→1), I(SO J=56→45)/I(H2CO J=30,3→20,2), and I(H2CO J=303 →202)/I(C18O J=2→1) in temperature units. While the I(H2CO)/I(C18O) ratio is fairly constant in the disk, the I(SO)/I(C18O) and I(SO)/I(H2CO) present a clear NE-SW gradient with its minimum value toward the dust trap. Although there is a large dispersion, there appears to be an anticorrelation with C18O intensity, which is a measure of column density, which in turn is thought to correlate (assuming a disk-like or ring morphology) with the local density.

