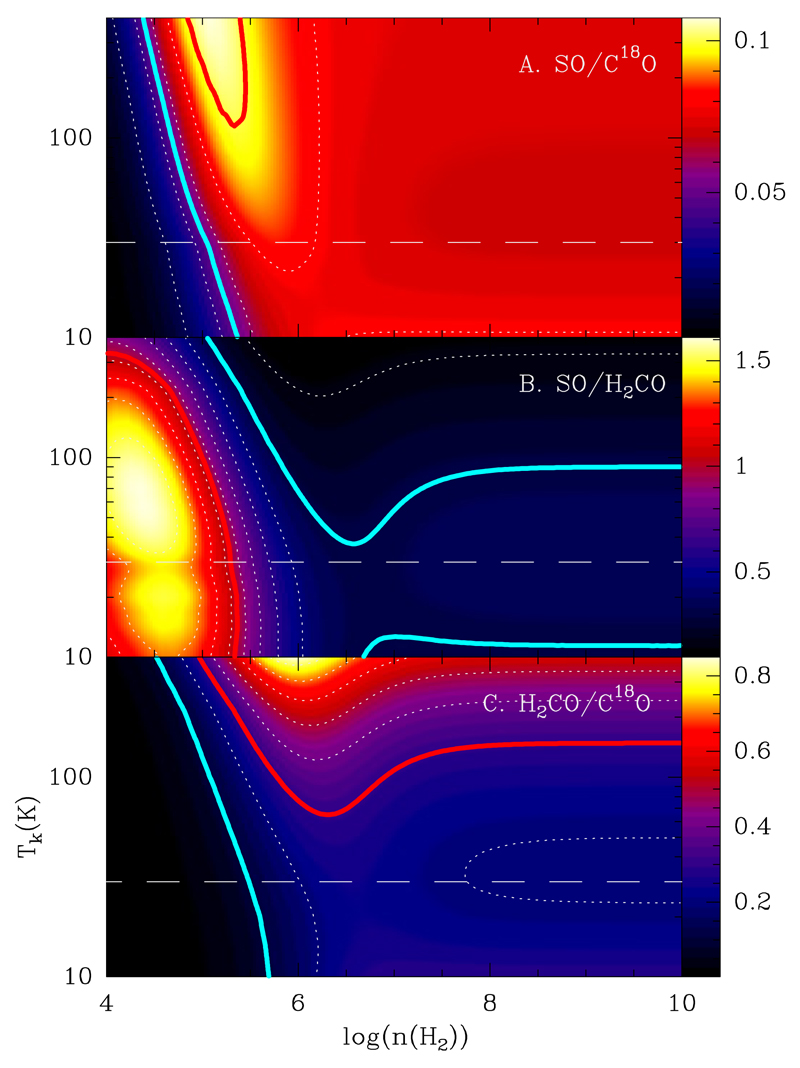
Fig. 6.
LVG calculations. We assumed N(SO)=2×1013 cm−2, N(H2CO)=1×1013 cm−2, and N(C18O)= 2×1016 cm−2. From top to bottom, we plot the I(SO J=56→45)/I(C18O J=2→1), I(SO J=56→45)/I(H2CO J=30,3→20,2), and I(H2CO J=303 →202)/I(C18O J=2→1) line intensity ratios. The long-dashed line corresponds to a gas kinetic temperature of Tk=30 K, which is the midplane temperature derived by Piétu et al. (2005) and Pacheco-Vázquez et al. (2015). Solid lines indicate the values derived from our maps (Fig. 5). The red and blue lines trace the maximum and minimum observed ratios, respectively.

