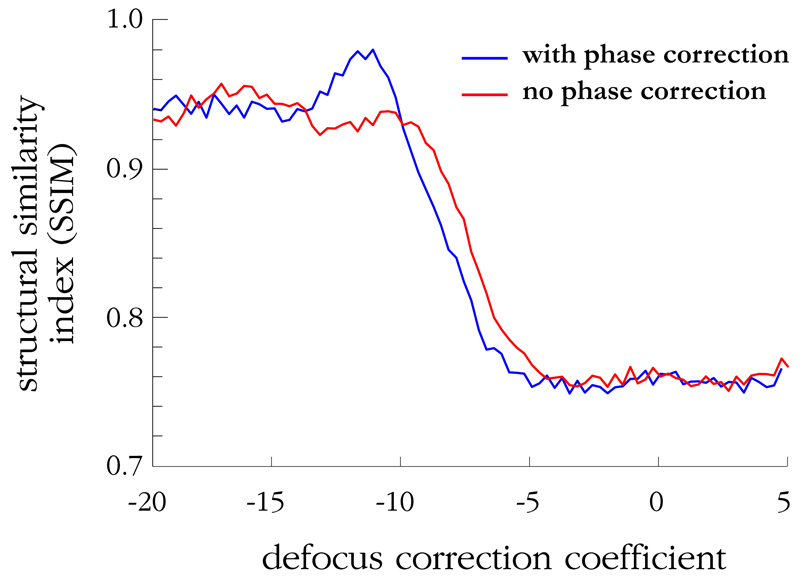
Fig. 7.
Graph showing the mean structural similarity index, K, between the experimentally reconstructed image and the simulated reconstructed image of Figure 3e vs. defocus correction coefficient for the phase-corrected and uncorrected cases. A significant increase is observed for the phase-corrected case, indicating that the focus is being adjusted successfully to recreate the original image.

