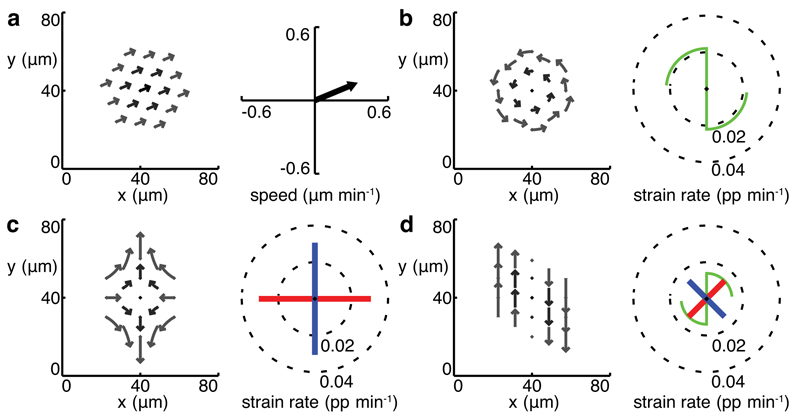
Figure 1. Measuring tissue strain rates in simulated data.
(a)-(d) left panels trajectories, right panels domain translation (a) and tissue strain rates (b)-(d) for simulated domains (nc = 2, dt = 9 min). (a) the domain behaves as a rigid block translating with velocities uniform within the domain. (b) pure rotation. (c) balanced convergence and extension, or pure shear. (d) an equal combination of pure shear and rotation, or simple shear. Principal strain rates are represented by orthogonal line segments with length equal to strain rate amplitude (blue positive, red negative). Rotation is represented by a green scythe motif, with radius indicating radians per minute on the same scale as the strain rates. Blades point in the direction of rotation (anticlockwise in (b), clockwise in (d)).

