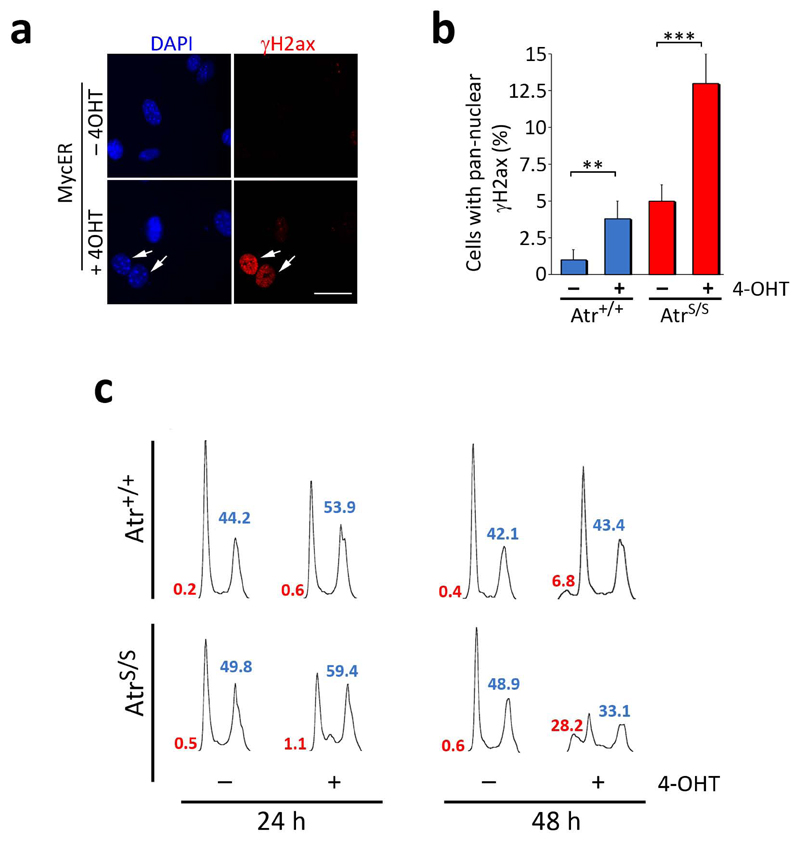
Fig. 3.
Atr suppresses Myc-induced RS and apoptosis. (a) Images illustrating the staining pattern of the γH2ax (red) signal on MycER infected MEF. Scale bar indicates 10 μm. (b) Percentage of cells showing a pan-nuclear distribution of γH2ax in MycER infected MEF of the different genotypes in the presence or absence of 4-OHT for 24 hrs. (c) Cell cycle profiles of MycER infected MEF of the different genotypes in the presence or absence of 4-OHT for 24 or 48 hrs. Sub-G1 (red) and S+G2 (blue) percentages are indicated. The images show a representative experiment that was repeated 3 times with independent MEF pairs. (**: P<0.01; ***: P<0.001)

