Fig. 4.
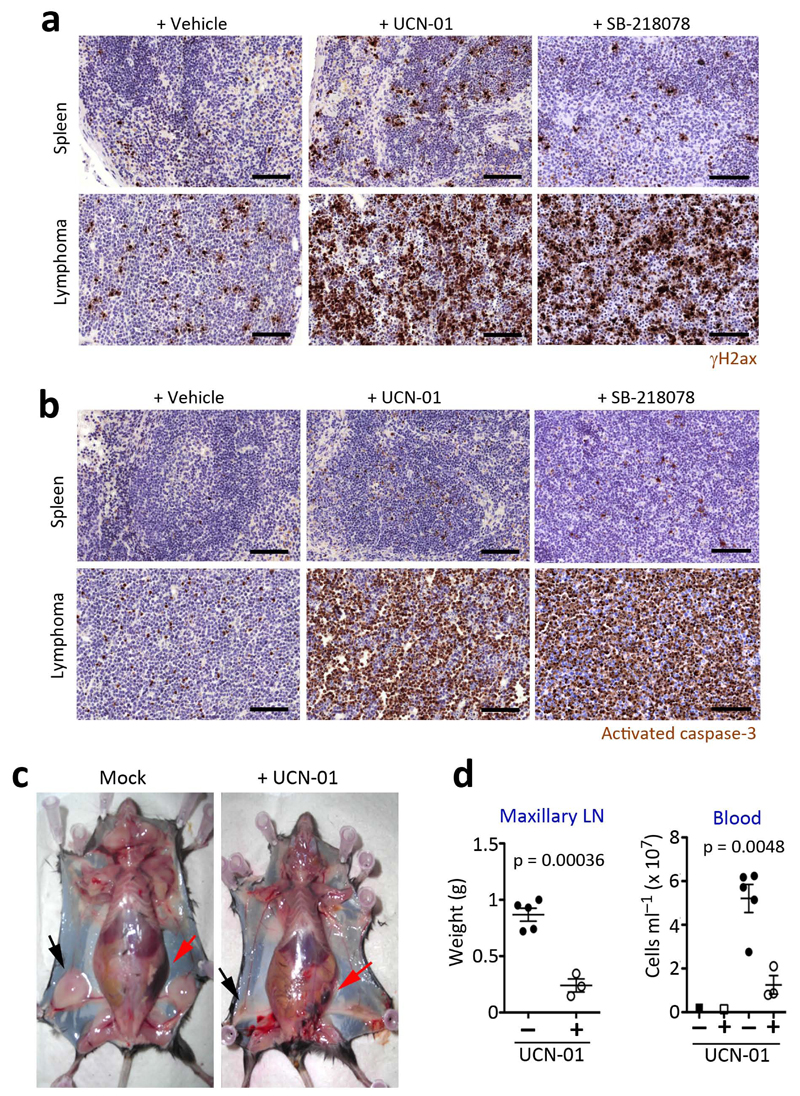
Treatment of Myc-induced lymphomas with Chk1 inhibitors. Representative images of (a) γH2ax and (b) activated caspase-3 (C3A) immunohistochemistry (IHC) done on the spleens of mice with or without Myc-induced lymphomas, after a 16 hr treatment with UCN-01 or SB-218078 (5 mg per kg). Black scale bars indicate 100 μm. (c) Representative images of mice carrying Myc-induced lymphomas with or without a daily treatment of UCN-01 (5 mg per kg) for 9 days. The arrows indicate the enlarged lymph nodes (black) and spleen (red) present in the mice carrying Myc-induced lymphomas to illustrate the regression of the tumor upon treatment. (d) Weights of the maxillary lymph nodes and total blood cell counts from the mice mentioned in (c).

